David N. Nicholson 0000-0003-0002-5761
· danich1
· dnicholson329
Genomics and Computational Biology Program, University of Pennsylvania, Philadelpia, PA, USA
· Funded by The Gordon and Betty Moore Foundation, GBMF4552; The National Human Genome Research Institute, R01 HG010067
Faisal Alquaddoomi 0000-0003-4297-8747
· falquaddoomi
Department of Biomedical Informatics, University of Colorado School of Medicine, Aurora, CO, USA; Center for Health Artificial Intelligence (CHAI), University of Colorado School of Medicine, Aurora, CO, USA
· Funded by The Gordon and Betty Moore Foundation, GBMF4552; The National Human Genome Research Institute, R01 HG010067
Vincent Rubinetti
· vincerubinetti
Department of Biomedical Informatics, University of Colorado School of Medicine, Aurora, CO, USA; Center for Health Artificial Intelligence (CHAI), University of Colorado School of Medicine, Aurora, CO, USA
· Funded by The Gordon and Betty Moore Foundation, GBMF4552; The National Human Genome Research Institute, R01 HG010067
Casey S. Greene✉ 0000-0001-8713-9213
· cgreene
· greenescientist
Department of Biomedical Informatics, University of Colorado School of Medicine, Aurora, CO, USA; Center for Health Artificial Intelligence (CHAI), University of Colorado School of Medicine, Aurora, CO, USA
· Funded by The Gordon and Betty Moore Foundation, GBMF4552; The National Human Genome Research Institute, R01 HG010067
✉ — Correspondence possible via GitHub Issues
or email to
Casey S. Greene <casey.s.greene@cuanschutz.edu>.
Abstract
While we often think of words as having a fixed meaning that we use to describe a changing world, words are also dynamic and changing.
Scientific research can also be remarkably fast-moving, with new concepts or approaches rapidly gaining mind share.
We examined scientific writing, both preprint and pre-publication peer-reviewed text, to identify terms that have changed and examine their use.
One particular challenge that we faced was that the shift from closed to open access publishing meant that the size of available corpora changed by over an order of magnitude in the last two decades.
We developed an approach to evaluate semantic shift by accounting for both intra- and inter-year variability using multiple integrated models.
Using this strategy and examining year-by-year changes revealed thousands of change points in both corpora.
We found change points for tokens including ‘cas9’, ‘pandemic’, and ‘sars’ among many others.
The consistent change-points between pre-publication peer-reviewed and preprinted text were largely related to the COVID-19 pandemic.
We developed a web app for exploration (https://greenelab.github.io/word-lapse/) that enables users to investigate individual terms.
To our knowledge, this analysis is the first to examine semantic shift in biomedical preprints and pre-publication peer-reviewed text, and it lays the foundation for future work to examine how terms acquire new meaning and the extent to which that process is encouraged or discouraged by peer review.
Keywords: Linguistic shift, pandemic, software, novelty
Introduction
Language constantly evolves, and the meaning we ascribe to words changes over time.
The word “nice” was used to mean foolish or innocent back in the 15th-17th century; then, it underwent a positive shift to its current meaning of “pleasant or delightful”[1].
These shifts occur for many reasons.
For example, writers may use new metaphors or substitute words for others with similar meanings in a process known as metonymy [1].
Studying these shifts can provide a nuanced understanding of how language adapts to describe our world.
Scientific fields of inquiry also change, sometimes rapidly, as researchers devise and test new hypotheses and applications.
For example, repurposing the CRISPR-Cas9 system to a pervasive tool for genome editing has altered how we discuss molecular entities.
Microbes use this as an immune system to defend against viruses.
Scientists repurposed this system for genome editing [2], leading to changes in the use of the term.
Science is a field with substantial written communication [3], both via published papers [4] and preprints [5,6].
Examining scientific manuscripts with computational linguistics can reveal longitudinal trends in scientific research.
The task of examining if words change their meanings is called semantic shift detection.
This process involves capturing word usage patterns such as frequency and structure over a set period of time [7].
Once these patterns have been captured, the last step is generating a time series showing possible shift events, commonly called changepoints [9].
Scientists have used this approach to discover many changepoints within publically available English corpora [10,11,12,13,14].
These discoveries included semantic changes like the meaning of awful shifting from majestic to horrible [15].
Along with individual discoveries, scientists have identified global patterns that semantic shifts can follow [15,16].
One pattern discovered is that words with similar meanings, i.e., synonyms, tend to change over time and undergo similar changes [16].
The other patterns are that words undergo semantic shifts inversely proportional to their frequency, and words with multiple meanings will have higher rates of change [15].
The majority of these discoveries have been within regular English text.
There has been an effort to investigate if any of these patterns are upheld within biomedical literature [17].
The researchers only found strong evidence of words that change meaning inversely scales to their usage frequency [18].
Despite the conflicting evidence for these change patterns, biomedical words and concepts change over time.
Most recent work to detect semantic shifts has been outside of biomedical corpora.
Common mediums include newspapers [19,20,21], books [15], reddit [22], and Twitter [23].
Researchers have examined topics in information retrieval [24], and in biomedicine COVID-19 has been examined multiple times [25,26,27].
Also, researchers have examined how drugs and disease pairs changed in their usage over time [18].
Despite these discoveries, the amount of open-access biomedical literature has dramatically increased in the last two decades, laying the groundwork for the large-scale analysis of semantic shifts in biomedicine.
There remains a gap in uncovering semantic change on a global scale within published and preprint works
and this work takes a deeper dive.
To fill this gap, we sought to uncover instances of semantic shifts within the rapidly growing body of open-access texts, published papers, and preprints.
We took a novel approach that integrates multiple models to account for the challenge of instability in the machine learning models trained across various years.
Using this approach, we identified semantic changepoints for each token and examine key changepoint cases.
We provided the full set of research products, including changepoints and machine learning models, as openly licensed tools for the community.
Lastly, we created a web server that allows users to analyze tokens of interest on the fly with respect to the most similar terms within a year and temporal trends.
Methods
Biomedical Corpora Examined
Pubtator Central
Pubtator Central is an open-access resource containing annotated abstracts and full-text annotated with entity recognition systems for biomedical concepts [28].
The methods used are TaggerOne [29] to tag diseases, chemicals, and cell line entities, GNormPlus [30] to tag
genes, SR4GN [31] to tag species, and tmVar [32] to tag genetic mutations.
We initially downloaded this resource on December 07th, 2021, and processed over 30 million documents.
This resource contains documents from the pre-1800s to 2021; however, due to the low sample size in the early years, we only used documents published from 2000 to 2021.
The resource was subsequently updated with documents from 2021.
We also downloaded a later version on March 09th, 2022, and merged both versions using each document’s doc_id field to produce the corpus used in this analysis.
We divided documents by publication year and then preprocessed each using spacy’s en_core_web_sm model [33].
We replaced each tagged word or phrase with its corresponding entity type and entity id for every sentence that contained an annotation.
Then, we used spacy to break sentences into individual tokens and normalized each token to its root form via lemmatization.
After preprocessing, we used every sentence to train multiple natural language models designed to represent words based on their context.
Biomedical Preprints
BioRxiv [5] and MedRxiv [6] are repositories that contain preprints for the life science community.
MedRxiv mainly focuses on preprints that mention patient research, while bioRxiv focuses on general biology.
We downloaded a snapshot of both resources on March 4th, 2022, using their respective Amazon S3 bucket [34,35].
This snapshot contained 172,868 BioRxiv preprints and 37,517 MedRxiv preprints.
These resources allow authors to post multiple versions of a single preprint.
We filtered every preprint to its most recent version to prevent duplication bias and sorted each preprint into its respective posted year.
Unlike Pubtator Central, these filtered preprints do not contain any annotations.
Therefore, we used TaggerOne [29] to tag every chemical and disease entity and GNormplus [30] to tag every gene and species entity for our preprint set.
Once tagged, we used spacy to preprocess every preprint as described in our Pubtator Central section.
Constructing Word Embeddings for Semantic Change Detection
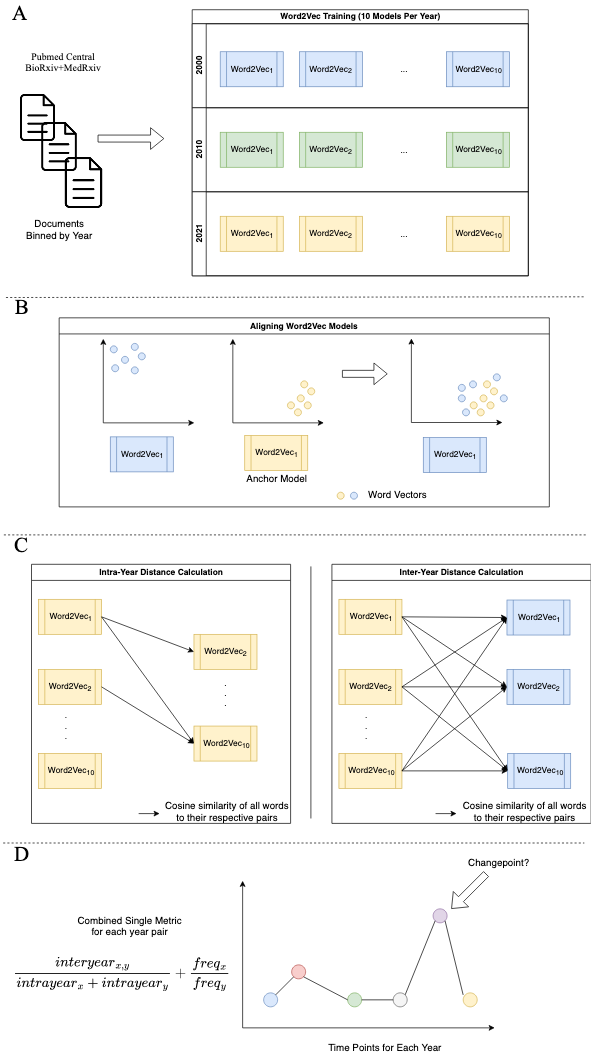
Figure 1: A. The first step of our data pipeline is where PMCOA papers and BioRxiv/MedRxiv preprints are binned by their respective posting year.
Following the binning process, we train ten word2vec models for each year’s manuscripts.
B. Upon training each individual word2vec model, we align every model onto an anchor model.
C. We capture token differences using an intra-year and inter-year approach.
Each arrow indicates comparing all tokens from one model with their respective selves in a different model.
D. The last step combines the above calculations into a single metric to allow for a time series to be constructed.
Once constructed, we use a statistical technique to autodetect the presence of a changepoint.
Word2vec [36] is a natural language processing model designed to model words based on their respective neighbors in the form of dense vectors.
This suite of models comes in two forms, a skipgram model and a continuous bags of words (CBOW) model.
The skipgram model generates these vectors by having a shallow neural network predict a word’s neighbors given the word, while the CBOW model predicts the word given its neighbors.
We used the CBOW model to construct word vectors for each year.
Despite the power of these word2vec models, these models are known to differ due to randomization within a year and year-to-year variability across years [37,38,39,40].
To control for run-to-run variability, we examined both intra-year and inter-year relationships.
Each year, we trained ten different CBOW models using the following parameters: vector size of 300, 10 epochs, minimum frequency cutoff of 5, and a window size of 16 for abstracts (Figure 1A).
Every model has its own unique vector space following training, making it difficult to compare two models without a correction step.
We used orthogonal Procrustes [41] to align models (Figure 1B).
We aligned all trained CBOW models for the Pubtator Central dataset to the first model trained in 2021.
Likewise, we aligned all CBOW models for the BioRxiv/MedRxiv dataset to the first model trained in 2021.
We used UMAP [42] to visually examine the aligned models.
We trained this model using the following parameters: cosine distance metric, random_state of 100, 25 for n_neighbors, a minimum distance of 0.99, and 50 n_epochs.
Detecting semantic changes across time
Once word2vec models are aligned, the next step is to detect semantic change.
Semantic change events are often detected through time series analysis [10].
We constructed a time series sequence for every token by calculating its distance within a given year (intra-year) and across each year (inter-year) (Figure 1C).
We used the model pairs constructed from the same year to calculate an intra-year distance.
Then, we calculated the cosine distance between each token and its corresponding counterpart for every generated pair.
Cosine distance is a metric bounded between zero and two, where a score of zero means two vectors are the same, and a score of two means both vectors are different.
For the inter-year distance, we used the Cartesian product of every model between two years and calculated the distance between tokens in the same way as the intra-year distance.
Following both calculations, we combined both metrics by taking the ratio of the average inter-year distance over the average intra-year distance.
This approach will penalize tokens with high intra-year instability and vice-versa for more stable tokens.
Along with token distance calculations, it has been shown that including token frequency improves results compared to using distance alone [43].
We calculated token frequency as the ratio of token frequency in the more recent year over the frequency of the previous year.
Then, we combined the frequency with distance ratios to make the final metric (Figure 1D).
Following time series construction, we performed changepoint detection, which is a process that uses statistical techniques to detect abnormalities within a given time series (Figure 1D).
We used the CUSUM algorithm [9] to detect these abnormalities.
This algorithm uses a rolling sum of the differences between two timepoints and checks whether the sum is greater than a threshold.
A changepoint is considered to have occurred if the sum exceeds a threshold.
We used the 99th percentile on every generated timepoint as the threshold.
Then, we ran the CUSUM algorithm using a drift of 0 and default settings for all other parameters.
Results
Models can be aligned and compared within and between years
We examined how the usage of tokens in biomedical text changes over time.
Our evaluation was derived from machine learning models designed to predict the actual token given a portion of its surrounding tokens.
Each token was represented as a vector in a coordinate space constructed by these models.
However, training these models is stochastic, which results in arbitrary coordinate spaces.
Model alignment is essential in allowing word2vec models to be compared [44,45].
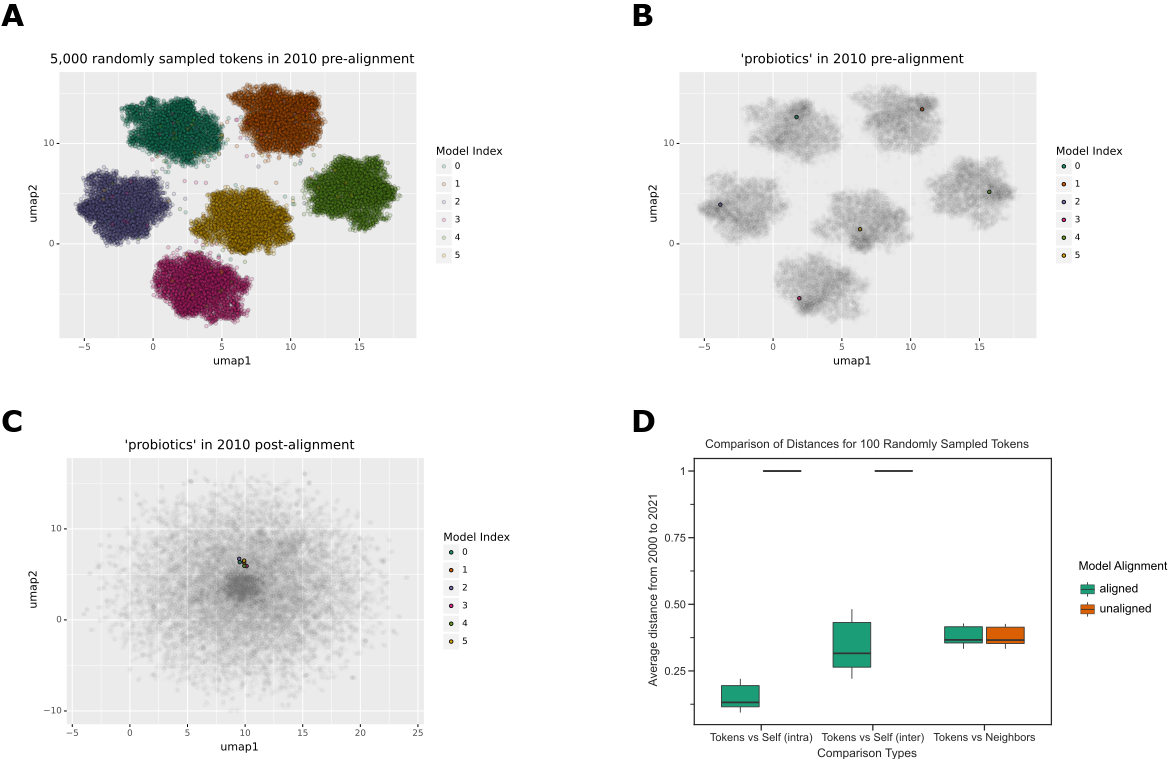
Before alignment, each model has its own unique coordinate space (Figure 2A), and each word is represented within that space (Figure 2B).
Alignment projects every model onto a shared coordinate space (Figure 2C), enabling direct token comparison.
We randomly selected 100 tokens to confirm that alignment worked as expected.
In aligned models, tokens in the global space were more similar to themselves within the year than between years, while identical tokens in unaligned models were completely distinct (Figure 2D).
Local distances were unaffected by alignment (Figure 2D), as token-neighbor distances were unaffected by the alignment procedure.
Figure 2: A. Without alignment, each word2vec model has its own coordinate space.
This is a UMAP visualization of 5000 randomly sampled tokens from 5 distinct Word2Vec models trained on the text published in 2010.
Each data point represents a token, and the color represents the respective Word2Vec model.
B. We greyed out all tokens except for the token ‘probiotics’ to highlight that each token appears in its own respective cluster without alignment.
C. After the alignment step, the token ‘probiotic’ is closer in vector space signifying that tokens can be easily compared.
D. In the global coordinate space, token distances appear to be vastly different when alignment is not applied.
After alignment, token distances become closer; tokens maintain similar distances with their neighbors regardless of alignment.
This boxplot shows the average distance of 100 randomly sampled tokens shared in every year from 2000 to 2021.
The x-axis shows the various groups being compared (tokens against themselves via intra-year and inter-year distances and tokens against their corresponding neighbors.
The y-axis shows the average distance for every year.
The landscape of biomedical publishing has changed rapidly during the period of our dataset.
The texts for our analysis were open-access manuscripts available through PubMed Central.
The growth in the amount of available text and the uneven adoption of open-access publishing during the interval studied was expected to induce changes in the underlying machine learning models, making comparisons more difficult.
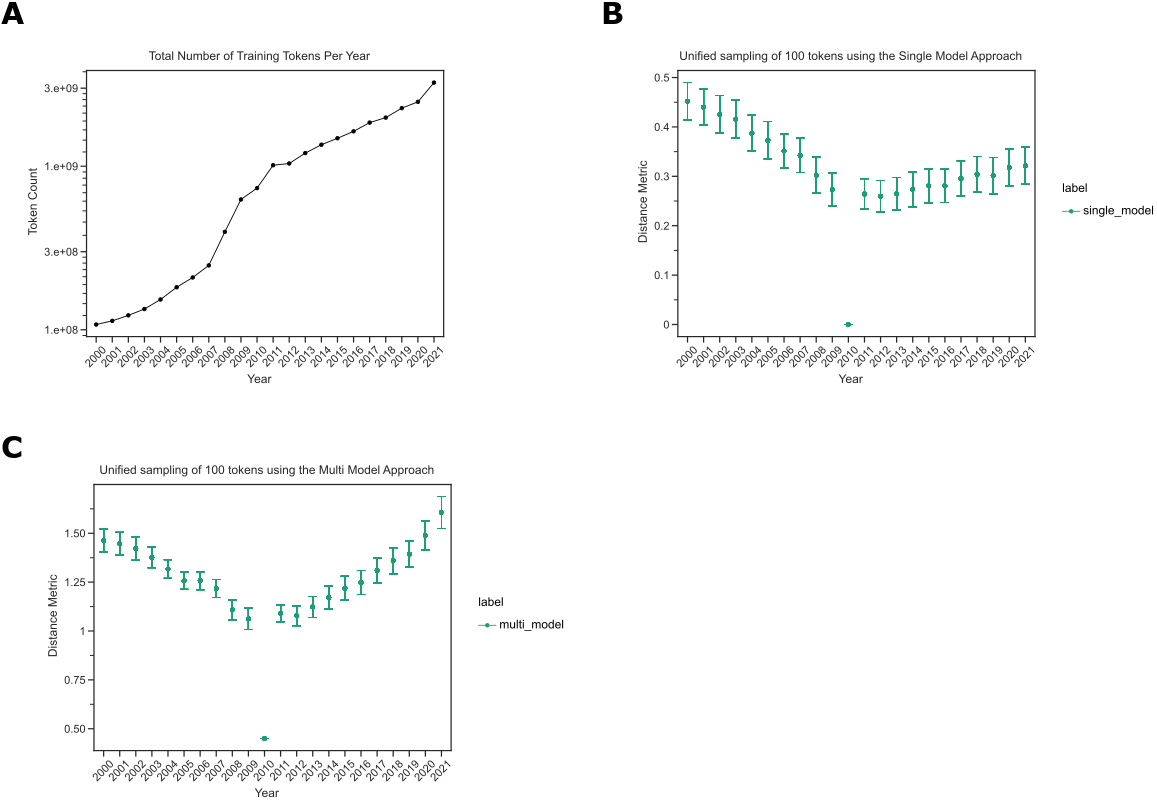
We found that the number of tokens available for model building, i.e., those in PMC OA, increased dramatically during this time (Figure 3A).
This was expected to create a pattern where models trained in earlier years were more variable than those from later years simply due to the limited sample size in early years.
We aimed to correct for this change in the underlying models by developing a statistic that, instead of using pairwise comparisons of token distances between individual models, integrated multiple models for each year by comparing tokens’ intra- and inter-year variabilities.
We defined the statistic as the ratio of the average distance between two years over the sum of the average distance within each year respectively.
Figure 3: A. The number of tokens our models have trained on increases over time.
This line plot shows the number of unique tokens our various machine-learning models see.
The x-axis depicts the year, and the y-axis shows the token count.
B. Earlier years compared to 2010 have greater distances than later years.
This confidence interval plot shows the collective distances obtained by sampling 100 tokens present from every year using a single model approach.
The x-axis shows a given year, and the y-axis shows the distance metric.
C. Later years have a lower intra-distance variability compared to the earlier years.
This confidence interval plot shows the collective distances obtained by sampling 100 tokens present from every year using our multi-model approach.
The x-axis shows a given year, and the y-axis shows the distance metric.
We expected most tokens to undergo minor changes from year to year, while substantial changes likely suggested model drift instead of true linguistic change.
We measured the extent to which tokens differed from themselves using the standard single-model approach and our integrated statistic.
We filtered the token list to only contain tokens present in every year and compared their distance to the midpoint year, 2010, using the single-model and integrated-models strategies.
We found that distances tended to be markedly larger in the earliest years, where we expected models to be least stable, using the traditional approach (Figure 3B).
The integrated model approach did not display the same pattern in the earliest years (Figure 3C).
Both trends reinforce that training on smaller corpora will lead to high variation and that an integrated model strategy is needed [39].
Based on these results, we used the integrated-model strategy to calculate inter-year token distances for the remainder of this work.
Terms exhibit detectable changes in usage
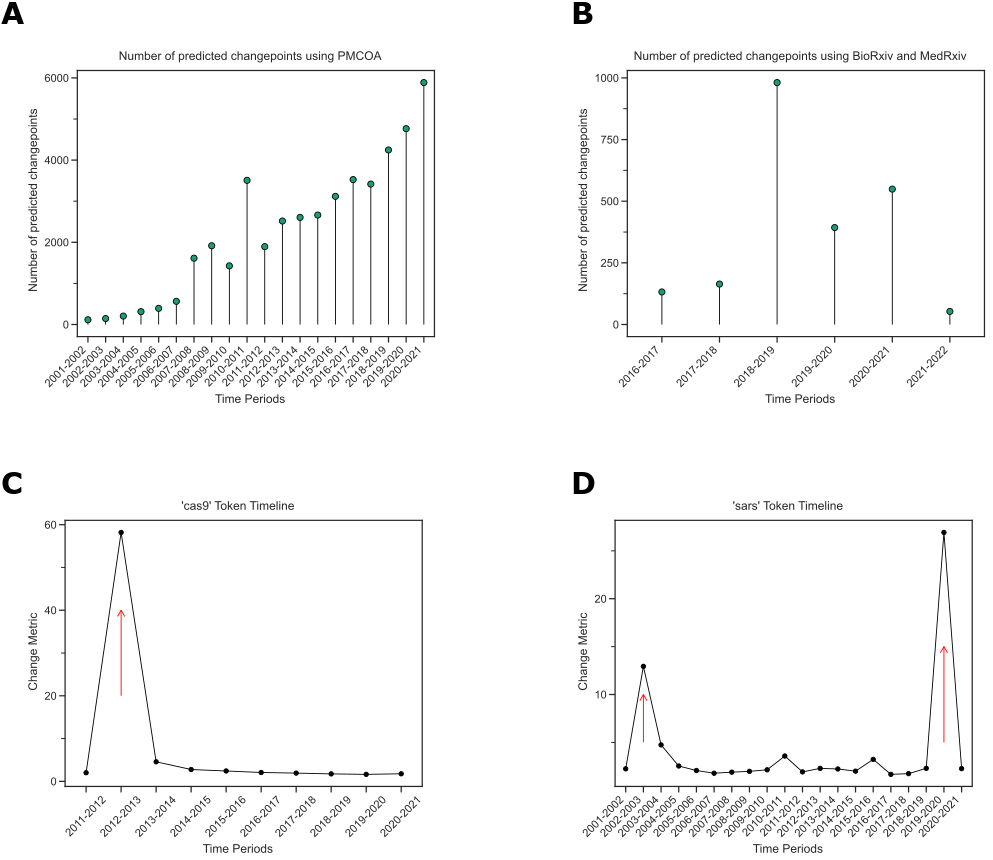
Figure 4: A. The number of change points increases over time in PMCOA.
The x-axis shows the various time periods, while the y-axis depicts the number of detected changepoints.
B. Regarding preprints, the greatest number of change points was during 2018-2019.
The x-axis shows the various time periods, while the y-axis depicts the number of detected change points.
C. The token ‘cas9’ was detected to have a changepoint between 2012 and 2013.
The x-axis shows the time period since the first appearance of the token, and the y-axis shows the change metric.
D. ‘sars’ has two detected changepoints within the PMCOA corpus.
The x-axis shows the time period since the first appearance of the token, and the y-axis shows the change metric.
We next sought to identify tokens that changed during the 2000-2021 interval for the text from PubMed Central’s Open Access Corpus (PMCOA) and the 2015-2022 interval for our preprint corpus.
We performed change point detection using the CUSUM algorithm with distances calculated with the integrated-model approach to correct for systematic differences in the underlying corpora.
We found 41281 terms with a detected change point from PMCOA and 2266 terms from preprints (Figures 4A and 4B), and the vast majority (38019 for PMCOA and 2260 for preprints) had just a single change-point.
We explored individual change points.
We detected one in PMCOA for ‘cas9’ from 2012 to 2013 (Figure 4C).
Before the change point, its closest neighbors were related genetic elements (e.g., ‘cas’1-3).
After the change point, its closest neighbors became terms related to targeting, sgRNA, and gRNA, as well as other genome editing strategies, ’talen’ and ‘zfns’ (Table 1).
For some terms, we detected multiple change points within the studied interval.
We detected change points for ‘SARS’ from 2002 to 2003 and 2019 to 2020 (Figure 4D), consistent with the emergences of SARS-CoV [46] and SARS-CoV-2 [47,48] as observed human pathogens.
We found miscellaneous neighbors before each change point, with use consistent with the acronym for Severe Acute Respiratory Syndrome after each (Tables 2 and 3).
Out of all change points, we observed 200 tokens with at least one change point in each corpus.
Only 25 of the 200 terms were detected to have simultaneous changes between the preprint and PMCOA corpora.
We examined the overlap of detected change points between preprints and published articles.
Many of these 25 were related to the COVID-19 pandemic (Supplementary Table S1).
The complete set of detected change points is available for further analysis (see Data Availability and Software).
Table 1: The fifteen most similar neighbors to the token ‘cas9’ for the years 2012 and 2013.
2012
2013
cas2
sgrna
crispr1
talen
cas3
spcas9
cas1
zfns
cas10
grna
crispr3
zfn
tracrrna
dcas9
crispr
nickase
csn1
pcocas9
crispr4
crispr
cas7
sgrnas
cas6e
meganuclease
cas4
tracrrna
cse1
crispri
cas6
crrna
Table 2: The fifteen most similar neighbors to the token ‘sars’ for the years 2002 and 2003.
2002
2003
qsar
species_227859
herbicidal
mesh_c000657245
antiplasmodial
severe acute respiratory syndrome-related coronavirus (species_694009)
arylpiperazine
unidentified human coronavirus (species_694448)
a]pyridine
SARS1 (gene_6301)
leishmanicidal
ebola virus sp. (species_205488)
naphthyridine
pandemic
indolo[2,1
coronavirus infections (mesh_d018352)
b]quinazoline-6,12
coronavirus
nematocidal
ebola virus (species_1570291)
f]isoxazolo[2,3
severe acute respiratory syndrome (mesh_d045169)
5-(4
paramyxovirus
cholinephosphotransferase
viruse
oxovanadium(iv
drosten
catecholase
virologist
Table 3: The fifteen most similar neighbors to the token ‘sars’ for the years 2019 and 2020.
2019
2020
g.o.
sar
nsp13
mers
40/367
cov
lissodendoryx
sars-1
lutken
severe acute respiratory syndrome-related coronavirus (species_694009)
sarr
coronaviruse
sar
middle east respiratory syndrome-related coronavirus (species_1335626)
ophiura ophiura (species_72673)
cov.
verrill
coronavirus infections (mesh_d018352)
hirondelle
mers-
kobelt
covs
azorean
severe acute respiratory syndrome coronavirus 2 (species_2697049)
rusby
severe acute respiratory syndrome (mesh_d045169)
d’orbigny
sarscov
psychropotes longicauda (species_55639)
sarscov-2
The word-lapse application is an online resource for the manual examination of biomedical tokens
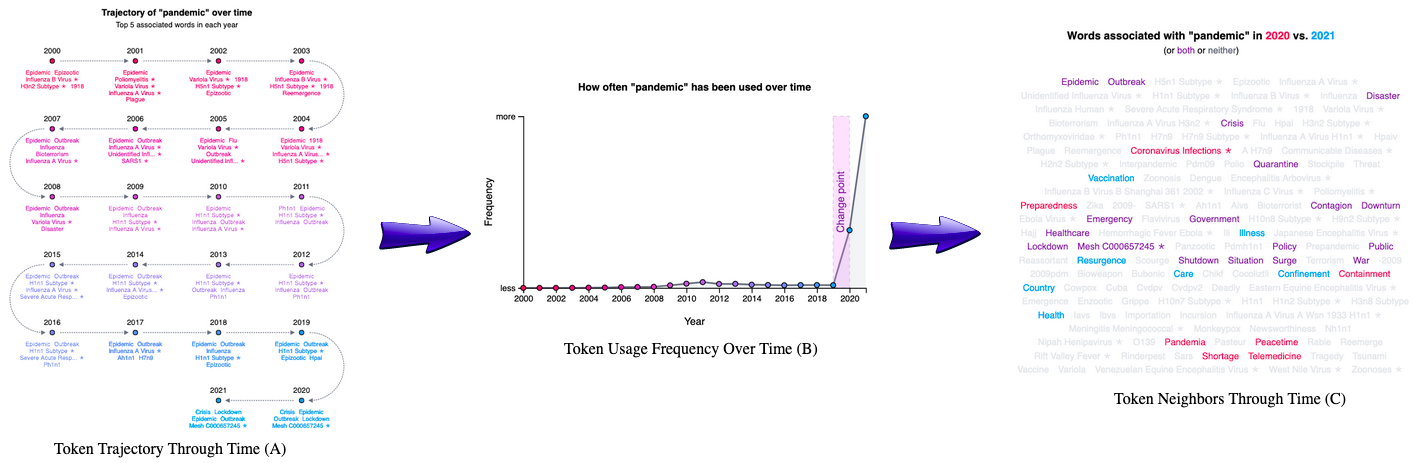
Figure 5: A. The trajectory visualization of the token ‘pandemic’ through time.
It starts at the first mention of the token and progresses through each subsequent year.
Every data point shows the top five neighbors for the respective token.
B. The usage frequency of the token ‘pandemic’ through time.
The x-axis shows the year, and the y-axis shows the frequency for each token.
C. A word cloud visualization for the top 25 neighbors for the token ‘pandemic’ each year.
This visualization highlights each neighbor from a particular year and allows for the comparison between two years.
Tokens in purple are shared within both years, while tokens in red or blue are unique to their respective year.
We constructed an online application that allows users to examine how tokens change through time.
The application supports token input as text strings or as MeSH IDs, Entrez Gene IDs, and Taxonomy IDs.
Users might elect to explore the term ‘pandemic’, for which we detected a change point between 2019 and 2020.
Users can examine the token’s nearest neighbors through time (Figure 5A).
Using the token ‘pandemic’ as an example, users can observe that ‘epidemic’ remains similar through time, but taxid:114727 (the H1N1 subtype of influenza) only entered the nearest neighbors with the swine flu pandemic in 2009 and that MeSH:C000657245 (COVID-19) appeared in 2020.
The application also shows a frequency chart depicting how often the particular token is used each year (Figure 5B), which can be displayed as a raw count or adjusted by the total size of the corpus.
When change points are detected, they are indicated on this panel (Figure 5B).
The final visualization shows the union of the nearest 25 neighbors from each year ordered by the number of years that neighbor was present (Figure 5C).
This visualization has a comparison function allowing users to examine years’ differences.
All functionalities are fully supported across the PMCOA and preprint corpora, and users can toggle between the two.
Discussion
Language is rapidly evolving, and the usage of words changes over time, with words assimilating new meanings or associations [1].
Some efforts have been made to study semantic change using biomedical text [25,26,27]; however, no such work has examined the changes evident in both pre-publication peer-reviewed and preprinted biomedical text.
We examined semantic changes within open-access biomedical corpora, Pubmed (PMCOA), and bioRxiv/MedRxiv, for the 2000-2022 interval.
We developed a novel statistic incorporating multiple Word2Vec models to examine semantic changes over two decades.
Before calculating our novel statistic, we used orthogonal processes that align each model (Figure 2).
We found that word vectors are closer together after alignment; however, the best approach to align models still remains open for future investigation [49].
As previously reported [39,50], we did find that without a correction step for the variability within and across years, comparing stable and unstable models is challenging.
Our correction approach showed that the average distances in the earlier years have less variability using multiple models than a single model (Figure 3).
After correcting year variability, our analysis revealed more than 41,000 changepoints, including tokens such as ‘cas9’, ‘pandemic’, and ‘sars’ (Figure 4).
Many changepoints overlapping between PMCOA and preprints were related to COVID-19 (Table S1), indicating that the COVID-19 pandemic has been strong and immediate enough to induce rapid semantic change across both publishing paradigms [51,52].
We developed a web application that allows users to manually examine individual tokens, making examining other examples within our 41,000 changepoints easier.
However, approaches that can automatically validate these changepoints is an essential area that remains open for future investigation.
Conclusion
We uncovered semantic changes within biomedical literature using a novel approach that accounts for inter- and intra-year variability.
Our approach found 41,000 changepoints that include well-known examples such as ‘cas9’, ‘pandemic’, and ‘sars’.
We constructed a web application that allows users to manually examine these individual changepoints.
As an extension to this project, future work may be able to determine the consistency and time-lag of semantic change between preprint and pre-publication peer-reviewed text - potentially predicting future change in pre-publication peer-reviewed text.
Furthermore, including other preprint repositories may reveal consistencies across a broader swath of fields, or within-field analyses may reveal the earliest starting points of semantic changes that ultimately sweep through biomedicine.
Overall, this work is one starting point regarding semantic change within biomedical literature, and we are excited to see how this landscape will change as time progresses.
This work was supported by the Gordon and Betty Moore Foundation under award GBMF4552 and the National Institutes of Health’s National Human Genome Research Institute under award R01 HG010067 to CSG.
The funders had no role in the study design, data collection, and analysis, decision to publish, or preparation of the manuscript.
Response to Reviewers
Reviewer 1
In this paper, the authors presented a method to examine the semantic shift in biomedical preprints and pre-publication by machine learning method. This work is very impressive and could have a great impact on the domain. However, the following questions should be addressed before publication.
Q1: In this work, the author applied word2vec model to train the word embeddings. The main issue is that word2vec has a limited capability to capture contextual information. I would suggest the authors try other more advanced language model, like BERT to train embeddings.
At the time of this work, we found that Word2Vec was easier to interpret than BERT.
Given that true changepoints are unknown and the lack of a consensus gold standard, we decided to move forward with Word2Vec to benefit from the model’s interpretability.
However, we agree that using BERT or related language models is an important area for future work.
Q2: How does the method take care of the new word issue? basically, if there’s a word created in this domain for only a few years and there are very few publications talking about it, then how the performance of this method would be?
In the most technical sense, a new word could be detected as having a changepoint for any potential string of subsequent years in which the word appeared in both corpora.
However, we think that most new words are unlikely to be detected as they settle into initial use because most new words will occur relatively few times in the literature.
This would lead to high intra-year variability, reducing the likelihood of a discovered changepoint (this is the intent of our correction for intra-year variability between models).
The case where a new word would have detectable changepoints would be limited to those where the use is sufficiently common that its positioning can be estimated reliably and where its positioning changes between subsequent years.
Q3: When detecting semantic changes, the cosine distance was used for comparing similarities between words. This method seems too easy and not that robust. Are there any other good ways for detecting?
New ways of detecting semantic change remain open for investigation.
However, most work that detects semantic changes uses cosine similarity (1-cosine distance).
We added the intra- and inter-year comparisons in part to improve the robustness of this metric, which is widely used within the field.
Due to this work being the first within biomedical literature, we adapted the commonly used metric, but we agree with the reviewer that future work should explore additional metrics.
Reviewer 2
This paper develops a method to evaluate semantic shifts by calculating annual and interannual changes using multiple integrated models. This method achieves good results, but there are some shortcomings in the paper. There are some suggestions for revision.
1. The motivation is not clear. Please specify the importance of this paper.
We have updated our introduction to make our motivation for this work more clear.
Please highlight the contributions of this paper.
We have updated our introduction to make our contributions for this work more clear.
Most of references are out of date. Please discuss more recently published solutions, especially the solutions published in 2022.
We have updated our introduction to include more recent publications that pertain to this work.
In the method part, the authors’ description is not easy to understand. Have the authors considered using drawings to explain the method?
We agree with the reviewer that this was a significant opportunity for improvement.
We have updated our methods section to include a graphical depiction of our data pipeline, which is now Figure 1.
When detecting semantic changes across time, the authors mention the use of Cartesian products in calculating interannual changes. What are the advantages of using Cartesian products for the task of this paper?
The main advantage here is that the cartesian product lets us directly compute the inter-year distances.
Since we compute all possible combinations of model pairings, our sample size is sufficiently large enough to obtain reliable inter-year distance estimates for the years studied (noting that we removed pre-2000 literature due to the limited size of PubMed in these years).
There is something unclear about Figure 1. There are five black dots in the second picture of Figure 1. What is the specific meaning of these five black dots? Please explain it to the author.
We added a new figure (now referred to as Figure 1) to our manuscript that shows our entire data processing pipeline, and this step here refers to part B in our new figure.
To allow for direct comparison between word vectors, we need to have word2vec models aligned (part B in our new figure 1).
The black dots in the figure mentioned by the reviewer are the individual word vectors obtained from their corresponding word2vec model.
We greyed out all tokens except for the word vector: ‘probiotics’ to provide an individual example of what occurs when word2vec models aren’t aligned.
Figure 2 has some ambiguities. The authors use single model and multiple model to carry out experiments, and the experimental results are different. Other than using different models, what could be the reason for the difference?
One reason for the differences is that our correction metric allows for different scales of differences.
Since we are taking a ratio of the inter-year distances over the intra-year distances, we encounter values that are greater than 0.
Ultimately, the point for figure 2 is to show that the confidence intervals are a lot smaller when variability is accounted for than not.
For the proposed method, has the author considered applying it to the same type of task and achieving similar results as in this paper? Please explain it to the readers.
We have thought of using this approach outside of biomedical literature.
However, we determined that this direction would be outside our paper’s scope.
We mention this point as a future direction within our manuscript.
More discussions of technical details should be given.
We have updated our manuscript to provide additional discussion of the underlying technical details.
Reviewer 3
• The introduction is not clear and very less literature is used. Follow this instruction: The introduction should briefly place the study in a broad context and highlight why it is important. It should define the purpose of the work and its significance, including specific hypotheses being tested. The current state of the research field should be reviewed carefully, and key publications cited. Please highlight controversial and diverging hypotheses when necessary. Finally, briefly mention the main aim of the work and highlight the main conclusions. Keep the introduction comprehensible to scientists working outside the topic of the paper.
• In the introduction, what key theoretical perspectives and empirical findings in the main literature have already informed the problem formulation? What major, unaddressed puzzle, controversy, or paradox does this research address?
We have updated our introduction to include more recent publications and discussion in relation to this work.
• Authors should further clarify and elaborate novelty in their contribution.
We have updated our introduction to make our contributions for this work more clear.
• What are the limitations of the present work?
One limitation of this work is that changepoint validation can be challenging.
Due to this being the first time this work has been performed, there isn’t an available widely-agreed upon gold standard set.
Our solution to circumvent this problem is that we provide a website that allows users to investigate our changepoint list further.
Reviewer 4
This is a well-written manuscript to examine semantic shift in open access biomedical preprints and pre-publication peer-reviewed text. The methods are novel and are clearly described. The results are clearly presented. It is a pleasure and very easy for audience to follow the paper. It adds to scientific value of the relative research field. I suggest acceptance.
We appreciate the positive feedback from the reviewer.
Reviewer 5
Dear authors,
It is a pleasure to review your manuscript.
We appreciate the positive feedback from the reviewer.
My suggestion:
1. Thoroughly revise the manuscript.
We have thoroughly revised our manuscript based on the feedback that was given by the other reviewers and based on an additional proof-read of our work.
Visit the Submission Guidelines and place your manuscript according to the journal’s guidelines.
Preparing main manuscript text
Preparing illustrations and figures
Preparing tables
Preparing additional files
We have examined the journal guidelines and updated formatting.
The figures must be well displayed, the text of the figures must be legible.
We updated our figures to meet the journal’s requirements.
The introduction has few quotes, it is very short.
We have extended our introduction to include a more thorough discussion on previous work and highlight our contributions/motivation.
The methodology is not well detailed, there is no figure that represents the pipeline.
We have updated our methods section to include a graphical depiction of our data pipeline.
Reviewer 6
Reviewer Comments
Manuscript Number: Not Mentioned
The topic is exciting and shows how the words are changing over time. However, the authors must consider the following comments to improve the manuscript’s quality.
The authors can use a graphical representation of the proposed work.
We have updated our methods section to include a graphical depiction of our data pipeline.
The authors must explain how the methodology is unique.
Our work is the first example where year variability has been accounted for within a word2vec model.
The revised figure helps to demonstrate this approach, which previously was somewhat buried in the technical details of the methods section.
The resolution of the Figures can be improved for better visibility.
We updated our figures to meet the journal’s requirements.
The authors should discuss the computational complexity of the methods.
As with work focused on training machine learning models, it is difficult to estimate this precisely.
Because we add inter- and intra-year variability, we note that the distance calculations scale with the square of the number of models used per year and the number of years examined (if all combinations are calculated, as they are for our manuscript to examine stability over time); however, more efficiency could be gained in subsequent work by only examining subsequent year pairs now that the statistic has been evaluated.
Provide a separate discussion section that explains the complete details of the evaluation of the word meanings.
We updated our discussion per the given feedback.
Briefly details the reasons to consider few-year pairs such as (2002-2003), (2012-2013) and (2019-2020).
These year pairs in particular, are the time points where a semantic change has occurred.
Within our paper, we mention the tokens associated with these time points.
For example, 2012-2013 is associated with the ‘cas9’ token, which signifies cas9 obtaining an association with genome editing.
Verify the caption (title) for Table 3. (maybe 'The fifteen most similar neighbors to the token 'sars' for the years 2019 and 2020)
We have updated our caption for this table.
-Table: The fifteen most similar neighbors to the token 'sars' for the years 2002 and 2003.
+Table: The fifteen most similar neighbors to the token 'sars' for the years 2019 and 2020.
The authors should remove the citations from the Conclusion section.
We have removed the citation from our conclusion section.
Grammatical and spelling mistakes must be corrected.
We have revised our manuscript overall to correct for errors and grammar mistakes.
Proceedings of the 2018 Conference of the North American Chapter of
the Association for Computational Linguistics: Human Language
Technologies, Volume 1 (Long Papers) (2018) https://doi.org/gp574f
Natural Language Processing Reveals Vulnerable Mental Health Support Groups and Heightened Health Anxiety on Reddit During COVID-19: Observational Study
Daniel M Low, Laurie Rumker, Tanya Talkar, John Torous, Guillermo Cecchi, Satrajit S Ghosh
The species Severe acute respiratory syndrome-related coronavirus: classifying 2019-nCoV and naming it SARS-CoV-2
, Alexander E Gorbalenya, Susan C Baker, Ralph S Baric, Raoul J de Groot, Christian Drosten, Anastasia A Gulyaeva, Bart L Haagmans, Chris Lauber, Andrey M Leontovich, … John Ziebuhr