Jake Crawford 0000-0001-6207-0782
· jjc2718
· jjc2718
Genomics and Computational Biology Graduate Group, Perelman School of Medicine, University of Pennsylvania, Philadelphia, PA, USA
· Funded by National Institutes of Health’s National Cancer Institute (R01 CA237170); National Institutes of Health’s National Human Genome Research Institute (R01 HG010067)
Brock C. Christensen 0000-0003-3022-426X
Department of Epidemiology, Geisel School of Medicine, Dartmouth College, Lebanon, NH, USA; Department of Molecular and Systems Biology, Geisel School of Medicine, Dartmouth College, Lebanon, NH, USA
· Funded by National Institutes of Health’s National Cancer Institute (R01 CA216265, R01 CA253976)
Maria Chikina 0000-0003-2550-5403
· mchikina
Department of Computational and Systems Biology, School of Medicine, University of Pittsburgh, Pittsburgh, PA, USA
Casey S. Greene 0000-0001-8713-9213
· cgreene
· GreeneScientist
Department of Biochemistry and Molecular Genetics, University of Colorado School of Medicine, Aurora, CO, USA; Center for Health AI, University of Colorado School of Medicine, Aurora, CO, USA
· Funded by National Institutes of Health’s National Cancer Institute (R01 CA237170); National Institutes of Health’s National Human Genome Research Institute (R01 HG010067)
Abstract
In studies of cellular function in cancer, researchers are increasingly able to choose from many -omics assays as functional readouts.
Choosing the correct readout for a given study can be difficult, and which layer of cellular function is most suitable to capture the relevant signal may be unclear.
In this study, we consider prediction of cancer mutation status (presence or absence) from functional -omics data as a representative problem.
Since functional signatures of cancer mutation have been identified across many data types, this problem presents an opportunity to quantify and compare the ability of different -omics readouts to capture signals of dysregulation in cancer.
The TCGA Pan-Cancer Atlas contains genetic alteration data including somatic mutations and copy number variants (CNVs), as well as several -omics data types.
From TCGA, we focus on RNA sequencing, DNA methylation arrays, reverse phase protein arrays (RPPA), microRNA, and somatic mutational signatures as -omics readouts.
Across a collection of genes recurrently mutated in cancer, RNA sequencing and DNA methylation were the most effective predictors of mutation state.
Surprisingly, we found that for most mutated genes, they were approximately equally effective predictors.
Performance was more variable between mutations than it was between data types for the same mutation, and there was little difference between the top data types for the majority of genes.
We also found that combining data types into a single multi-omics model provided little or no improvement in predictive ability over the best individual data type.
Based on our results, for the design of studies focused on the functional outcomes of cancer mutations, we recommend focusing on gene expression or DNA methylation as first-line readouts.
Introduction
Although cancer can be initiated and driven by many different genetic alterations, these tend to converge on a limited number of pathways or signaling processes [1].
As driver mutation status alone confers limited prognostic information, a comprehensive understanding of how diverse genetic alterations perturb central pathways is vital to precision medicine and biomarker identification efforts [2,3].
While many methods exist to distinguish driver mutations from passenger mutations based on genomic sequence characteristics [4,5,6], until recently it has been a challenge to connect driver mutations to downstream changes in gene expression and cellular function within individual tumor samples.
The Cancer Genome Atlas (TCGA) Pan-Cancer Atlas provides uniformly processed, multi-platform -omics measurements across tens of thousands of samples from 33 cancer types [7].
Enabled by this publicly available data, a growing body of work on linking the presence of driving genetic alterations in cancer to downstream gene expression changes has emerged.
Recent studies have considered Ras pathway alteration status in colorectal cancer [8], alteration status across many cancer types in Ras genes [9,10], TP53[11], and PIK3CA[12], and alteration status across cancer types in frequently mutated genes [13].
More broadly, other groups have drawn on similar ideas to distinguish between the functional effects of different alterations in the same driver gene [14], to link alterations with similar gene expression signatures within cancer types [15], and to identify trans-acting expression quantitative trait loci (trans-eQTLs) in germline genetic studies [16].
These studies share a common thread: they each combine genomic (point mutation and copy number variation) data with transcriptomic (RNA sequencing) data within samples to interrogate the functional effects of genetic variation.
RNA sequencing is ubiquitous and cheap, and its experimental and computational methods are relatively mature, making it a vital tool for generating insight into cancer pathology [17].
Some driver mutations, however, are known to act indirectly on gene expression through varying mechanisms.
For example, oncogenic IDH1 and IDH2 mutations in glioma have been shown to interfere with histone demethylation, which results in increased DNA methylation and blocked cell differentiation [18,19,20,21].
Other genes implicated in aberrant DNA methylation in cancer include the TET family of genes [22] and SETD2[23].
Certain driver mutations, such as those in DNA damage repair genes, may lead to detectable patterns of somatic mutation [24].
Additionally, correlation between gene expression and protein abundance in cancer cell lines is limited, and proteomics data could correspond more directly to certain cancer phenotypes and pathway perturbations [25].
In these contexts and others, integrating different data modalities or combining multiple data modalities could be more effective than relying solely on gene expression as a functional signature.
Here, we compare -omics data types profiled in the TCGA Pan-Cancer Atlas to evaluate use as a multivariate functional readout of genetic alterations in cancer.
We focus on gene expression (RNA sequencing data), DNA methylation (27K and 450K probe chips), reverse phase protein array (RPPA), microRNA expression, and mutational signatures data [26] as possible readouts.
Prior studies have identified univariate correlations of CpG site methylation [27,28] and correlations of RPPA protein profiles [29] with the presence or absence of certain driver mutations.
Other relevant past work includes linking point mutations and copy number variants (CNVs) with changes in methylation and expression at individual genes [30,31] and identifying functional modules that are perturbed by somatic mutations [32,33].
However, direct comparison among different data types for this application is lacking, particularly in the multivariate case where we consider changes to -omics-derived gene signatures rather than individual genes in isolation.
We select a collection of potential cancer drivers with varying functions and roles in cancer development [34].
We use mutation status in these genes as labels to train classifiers, using each of the data types listed as training data, in a pan-cancer setting; we follow similar methods to the elastic net logistic regression approach described in Way et al. 2018 [9] and Way et al. 2020 [13].
We show that there is considerable predictive signal for many genes relative to a random baseline and that gene expression and DNA methylation generally provide the best predictions of mutation state.
Surprisingly, we find that across a variety of genes, gene expression and DNA methylation are approximately equally effective predictors.
We observe similar results for pan-cancer survival prediction across the same data types with little separation between the top-performing data types.
In addition, we observe that combining data types into a single multi-omics model for mutation prediction provides little, if any, performance benefit over the most performant model using a single data type.
Our results will help to inform the design of future functional genomics studies in cancer, suggesting that for many strong drivers with clear functional signatures, gene expression and DNA methylation measurements provide similar information content.
Methods
Mutation data download and preprocessing
To generate binary mutated/non-mutated gene labels for our machine learning model, we used mutation calls for TCGA samples from MC3 [35] and copy number threshold calls from GISTIC2.0 [36].
MC3 mutation calls were downloaded from the Genomic Data Commons (GDC) of the National Cancer Institute, at https://gdc.cancer.gov/about-data/publications/pancanatlas.
Copy number threshold calls are from an older version of the GDC data, and are available here: https://figshare.com/articles/dataset/TCGA_PanCanAtlas_Copy_Number_Data/6144122.
We removed hypermutated samples (defined as five or more standard deviations above the mean non-silent somatic mutation count) from our dataset to reduce the number of false positives (i.e., non-driver mutations).
After this filtering, 9,074 TCGA samples with mutation and copy number data remained.
Any sample with a non-silent somatic variant in the target gene was included in the positive set.
We also included copy number gains in the target gene for oncogenes and copy number losses in the target gene for tumor suppressor genes in the positive set; all remaining samples were considered negative for mutation in the target gene.
Omics data download and preprocessing
RNA sequencing, 27K and 450K methylation array, microRNA, and RPPA datasets for TCGA samples were all downloaded from GDC, at the same link provided above.
Mutational signatures information for TCGA samples with whole-exome sequencing data was downloaded from the International Cancer Genome Consortium (ICGC) data portal, at https://dcc.icgc.org/releases/PCAWG/mutational_signatures/Signatures_in_Samples/SP_Signatures_in_Samples.
For our experiments, we used only the “single base signature” (SBS) mutational signatures, generated in [26].
In general, before training classifiers or extracting PCA components from all of the data types, we standardized (took z-scores of) each column/feature of all data types.
For the RNA sequencing dataset, we generally used only the top 8,000 gene features by mean absolute deviation as predictors in our single-omics models, except where specified otherwise.
For the RPPA, microRNA, and mutational signatures datasets, all columns/features were used.
To remove missing values from the methylation datasets, we removed the 10 samples with the most missing values, then performed mean imputation for probes with 1 or 2 values missing.
All probes with missing values remaining after sample filtering and imputation were dropped from the analysis.
This left us with 20,040 CpG probes in the 27K methylation dataset and 370,961 CpG probes in the 450K methylation dataset.
For experiments where “raw” methylation data was used, we used the top 100,000 probes in the 450K dataset by mean absolute deviation for computational efficiency, and we used all of the 20,040 probes in the 27K dataset.
For experiments where “compressed” methylation data was used, we used principal component analysis (PCA), as implemented in the scikit-learn Python library [37], to extract the top 5,000 principal components from the methylation datasets.
We initially applied the beta-mixture quantile normalization (BMIQ) method [38] to correct for variability in signal intensity between type I and type II probes, but we observed that this had no effect on our results.
We report uncorrected results in the main paper for simplicity.
Comparing data modalities
We made three main comparisons in this study: one between different sets of genes using only expression data, one comparing expression and DNA methylation data types, and one comparing all data types.
This choice in comparisons was mainly due to sample size limitations, as running a single comparison using all data types would force us to use only samples that are profiled for every data type, which would discard a large number of samples that lack profiling on only one or a few data types.
Thus, for each of the three comparisons, we used the intersection of TCGA samples having measurements for all of the datasets being compared in that experiment.
This resulted in three distinct sets of samples: 9,074 samples shared between {expression, mutation} data, 7,981 samples shared between {expression, mutation, 27K methylation, 450K methylation}, and 5,226 samples shared between {expression, mutation, 27K methylation, 450K methylation, RPPA, microRNA, mutational signatures}.
When we dropped samples between experiments as progressively more data types were added, we observed that the dropped samples had approximately the same cancer type proportions as the dataset as a whole.
In other words, samples that were profiled for one data type but not another did not tend to come exclusively from one or a few cancer types.
Exceptions included acute myeloid leukemia (LAML) which had no samples profiled in the RPPA data, and ovarian cancer (OV) which had only 8 samples with 450K methylation data.
More detailed information on cancer type proportions profiled for each data type is provided in Supplementary Figure 8 and Supplementary Table 1.
For each target gene, in order to ensure that the training dataset was reasonably balanced (i.e. that there would be enough mutated samples to train an effective classifier), we included only cancer types with at least 15 mutated samples and at least 5% mutated samples, which we refer to here as “valid” cancer types.
After applying these filters, the number of valid cancer types remaining for each gene varied based on the set of samples used: more data types resulted in fewer shared samples, and fewer samples generally meant fewer valid cancer types.
In some cases, this resulted in genes with no valid cancer types, which we dropped from the analysis.
Out of the 127 genes from the original cancer gene set described in Vogelstein et al. 2013 [34], for the analysis using {expression, mutation} data we retained 85 target genes, for the {expression, mutation, 27k methylation, 450k methylation} analysis we retained 84 genes, and for the analysis using all data types we retained 75 genes.
We additionally explored mutation prediction from gene expression alone using three gene sets of equal size: the cancer-related genes from Vogelstein et al. 2013 described above, a set of frequently mutated genes in TCGA, and a set of random genes with mutations profiled by MC3.
To match the size of the Vogelstein et al. gene set, we took the 85 most frequently mutated genes in TCGA as quantified by MC3, all of which had at least one valid cancer type.
For the random gene set, we first filtered to the set of all genes with two or more valid cancer types by the above criteria, then sampled 85 of these genes uniformly at random.
Based on the results of the gene expression experiments, we used the Vogelstein et al. gene set for all subsequent experiments comparing -omics data types.
Training classifiers to detect cancer mutations
We trained logistic regression classifiers to predict whether or not a given sample had a mutational event in a given target gene using data from various -omics datasets as explanatory variables.
Our model was trained on -omics data (\(X\)) to predict mutation presence or absence (\(y\)) in a target gene.
To control for varying mutation burden per sample and to adjust for potential cancer type-specific expression patterns, we included one-hot encoded cancer type and log10(sample mutation count) in the model as covariates.
Since our -omics datasets tend to have many dimensions and comparatively few samples, we used an elastic net penalty to prevent overfitting [39] in line with the approach used in Way et al. 2018 [9] and Way et al. 2020 [13].
Elastic net logistic regression finds the feature weights \(\hat{w} \in \mathbb{R}^{p}\) solving the following optimization problem:
where \(i \in \{1, \dots, n\}\) denotes a sample in the dataset, \(X_i \in \mathbb{R}^{p}\) denotes features (omics measurements) from the given sample, \(y_i \in \{0, 1\}\) denotes the label (mutation presence/absence) for the given sample, and \(\ell(\cdot)\) denotes the negative log-likelihood of the observed data given a particular choice of feature weights, i.e.
This optimization problem leaves two hyperparameters to select: \(\alpha\) (controlling the tradeoff between the data log-likelihood and the penalty on large feature weight values), and \(\lambda\) (controlling the tradeoff between the L1 penalty and L2 penalty on the weight values).
Although the elastic net optimization problem does not have a closed form solution, the loss function is convex, and iterative optimization algorithms are commonly used for finding reasonable solutions.
For fixed values of \(\alpha\) and \(\lambda\), we solved for \(\hat{w}\) using stochastic gradient descent, as implemented in scikit-learn’s SGDClassifier method.
Given weight values \(\hat{w}\), it is straightforward to predict the probability of a positive label (mutation in the target gene) \(P(y^{*} = 1 \mid X^{*}; \hat{w})\) for a test sample \(X^{*}\):
and the probability of no mutation in the target gene, \(P(y^{*} = 0 \mid X^{*}; \hat{w})\), is given by (1 - the above quantity).
For each target gene, we evaluated model performance using two replicates of 4-fold cross-validation, where train and test splits were stratified by cancer type and sample type.
That is, each training set/test set combination had equal proportions of each cancer type (BRCA, SKCM, COAD, etc.) and each sample type (primary tumor, recurrent tumor, etc.).
To choose the elastic net hyperparameters, we used 3-fold nested cross-validation, with a grid search over the following hyperparameter ranges: \(\lambda\) = [0.0, 0.05, 0.1, 0.3, 0.5, 0.7, 0.9, 1.0] and \(\alpha\) = [0.0001, 0.001, 0.01, 0.1, 1, 10].
Using the grid search results, for each evaluation fold we selected the set of hyperparameters with the optimal area under the precision-recall curve (AUPR), averaged over the three inner folds.
Evaluating mutation prediction classifiers
Area under the receiver-operator curve (AUROC) [40] and area under the precision-recall curve (AUPR) [41] are metrics that are frequently used to quantify classification performance for a continuous or probabilistic output, such as that provided by logistic regression.
These metrics summarize performance across a variety of binary label thresholds, rather than requiring choice of a single threshold to determine positive or negative predictions.
In the main text, we report results using AUPR, summarized using average precision.
AUPR has been shown to distinguish between models more accurately than AUROC when there are few positively labeled samples [42,43].
As an additional correction for imbalanced labels, in many of the results in the main text we report the difference in AUPR between a classifier fit to true mutation labels and a classifier fit to data where the mutation labels are randomly permuted.
In cases where mutation labels are highly imbalanced (very few mutated samples and many non-mutated samples), a classifier with permuted labels may perform well simply by chance, e.g. by predicting the negative/non-mutated class for most samples.
To maintain the same label balance for the classifiers with permuted labels as the classifiers with the true labels, we permuted labels separately in the train and test sets for each cross-validation split.
Additionally, to maintain the same label proportions within each cancer type after permuting the labels, we permuted labels independently for each cancer type.
Recall that for each target gene and each -omics dataset, we ran two replicates of 4-fold cross-validation, for a total of eight performance results.
To make a statistical comparison between two models using these performance distributions, we used paired-sample t-tests, where performance measurements derived from the same cross-validation fold are considered paired measurements.
We used this approach to compare a model trained on true labels with a model trained on permuted labels (addressing the question, “for the given gene using the given data type, can we predict mutation status better than random”), and to compare a model trained on data type A with a model trained on data type B (addressing the question, “for the given gene, can we make more effective mutation status predictions using data type A or data type B”).
We corrected for multiple tests using a Benjamini-Hochberg false discovery rate correction.
For experiments where we chose a binary threshold for accepting/rejecting \(H_0\) we set a conservative corrected threshold of \(p = 0.001\); we were able to estimate the number of false positives by examining genes with better performance for permuted mutation labels than true labels.
We chose this threshold to ensure that none of the observed false positive genes were considered significant, since we would never expect permuting labels to improve performance.
However, our results were not sensitive to the choice of this threshold, and we display cutoffs of \(p = 0.05\) and \(p = 0.01\) in many of our plots as well.
Survival prediction using -omics datasets
As a complementary comparison to mutation prediction, we constructed predictors of patient survival using the clinical data available from the GDC, in the TCGA-CDR-SupplementalTableS1.xlsx file.
Following the methods described in [44], as the clinical endpoint we used overall survival (OS), except in nine cancer types with few deaths observed where we used progression-free intervals (PFI) as the clinical endpoint (BRCA, DLBC, LGG, PCPG, PRAD, READ, TGCT, THCA and THYM).
For prediction, we used Cox regression as implemented in the scikit-survival Python package [45], with patient age at diagnosis and log10(sample mutation count) included as covariates, as well as a one-hot encoded variable for cancer type in the pan-cancer case.
To ensure that the per-feature information content was comparable between -omics data types, we preprocessed the -omics datasets using PCA and extracted the top \(k\) principal components; in the case where the number of features in the original dataset was less than \(k\) we used all available PCs (that is, we set \(k = \min(p, k)\) where \(p\) is the number of features in the unprocessed dataset).
For the pan-cancer models we plot results over multiple values of \(k\): \(k \in \{10, 100, 500, 1000, 5000\}\); for the individual cancer type models we set \(k = 10\).
To model pan-cancer survival (results shown in main paper), we used the elastic net Cox regression implementation in scikit-survival (i.e. the CoxnetSurvivalAnalysis method).
To select hyperparameters for the elastic net Cox regression model, we performed a grid search over \(\lambda\) = [0.0, 0.05, 0.1, 0.3, 0.5, 0.7, 0.9, 1.0] and \(\alpha\) = [0, 1e-5, 1e-4, 5e-4, 0.001, 0.005, 0.01, 0.05, 0.1, 0.5, 1, 10, 100, 1000].
To model survival using data from individual cancer types (results shown in supplement), we found elastic net Cox regression to be unstable even for small feature dimensions, so we used the ridge-regularized Cox regresssion implementation in the CoxPHSurvivalAnalysis method in scikit-survival.
To select the regularization parameter \(\alpha\), we used the default selection procedure implemented in scikit-survival to determine a range of potential \(\alpha\) values based on the data.
This procedure begins by deriving the maximum \(\alpha\) value as the smallest value for which all coefficients are 0 (call this \(\alpha_{\text{max}}\)), then it selects 100 possibilities for alpha spaced evenly on a log scale between \(\alpha_{\text{max}}\) and \(0.01 \cdot \alpha_{\text{max}}\).
We found that for individual cancer types, this data-driven procedure resulted in more consistent and stable model convergence than choosing a fixed set of alphas to search over as in the pan-cancer survival prediction experiments.
We measured survival prediction performance using the censored concordance index (c-index) [46], which quantifies agreement between the order of survival time predictions and true outcomes for a held-out dataset; higher c-index values indicate more accurate survival prediction performance.
Similar to the mutation prediction experiments, we calculated c-index values on held-out subsets of the data for two replicates of 4-fold cross-validation, resulting in eight performance measurements for each model.
As a baseline, for both the pan-cancer and cancer type specific datasets, we constructed survival models using only non-omics covariates.
For the pan-cancer data, covariates included patient age at diagnosis, log10(sample mutation count), and a one-hot encoded variable for sample cancer type.
The cancer type-specific baseline models were the same, without the cancer type indicator, since all train and test samples were derived from the same cancer type.
Multi-omics mutation prediction experiments
To predict mutation presence or absence in cancer genes using multiple data types simultaneously, we concatenated individual datasets into a large feature matrix, then used the same elastic net logistic regression method described previously.
For this task, we considered only the gene expression, 27K methylation, and 450K methylation datasets.
We used only these data types to limit the number of multi-omics combinations; the expression and methylation datasets resulted in the best overall performance across the single-omics experiments, so we limited combinations to those datasets.
In the main text, we report results using the top 5,000 principal components for each dataset , which ensures that most variance is captured (approximately 95-98% of variance for each data type).
In the supplement, we also report results using “raw” features: for gene expression we used all 15,639 genes available in our RNA sequencing dataset, and for the 27K and 450K methylation datasets we used the top 20,000 CpG probes by mean absolute deviation.
To construct the multi-omics models, we considered each of the pairwise combinations of the datasets listed above, as well as a combination of all 3 datasets.
When combining multiple datasets, we concatenated along the column axis and included covariates for cancer type and sample mutation burden as before.
For all multi-omics experiments, we used only the samples from TCGA with data for all three data types (i.e. the same 7,981 samples used in the single-omics experiments comparing expression and methylation data types).
We considered a limited subset of well-performing genes from the Vogelstein et al. gene set as target genes, including EGFR, IDH1, KRAS, PIK3CA, SETD2, and TP53.
We selected these genes because we had previously observed that they have good predictive performance and because they represent a combination of alterations that have strong gene expression signatures (KRAS, EGFR, IDH1, TP53) and strong DNA methylation signatures (IDH1, SETD2, TP53).
Data and code availability
All analyses were implemented in the Python programming language and are available in the following GitHub repository: https://github.com/greenelab/mpmp under the open-source BSD 3-clause license.
Scripts to download large data files from GDC and other sources are located in the 00_download_data directory.
Scripts to run experiments comparing data modalities used individually are located in the 02_classify_mutations directory, scripts to run multi-omics experiments are located in the 05_classify_mutations_multimodal directory, and scripts to run survival prediction experiments are located in the 06_predict_survival directory.
The Python environment was managed using conda, and directions for setting up the environment can be found in the README.md file. All analyses were run locally on a CPU.
This manuscript was written using Manubot [47] and is available on GitHub at https://github.com/greenelab/mpmp-manuscript.
Results
Using diverse data modalities to predict cancer alterations
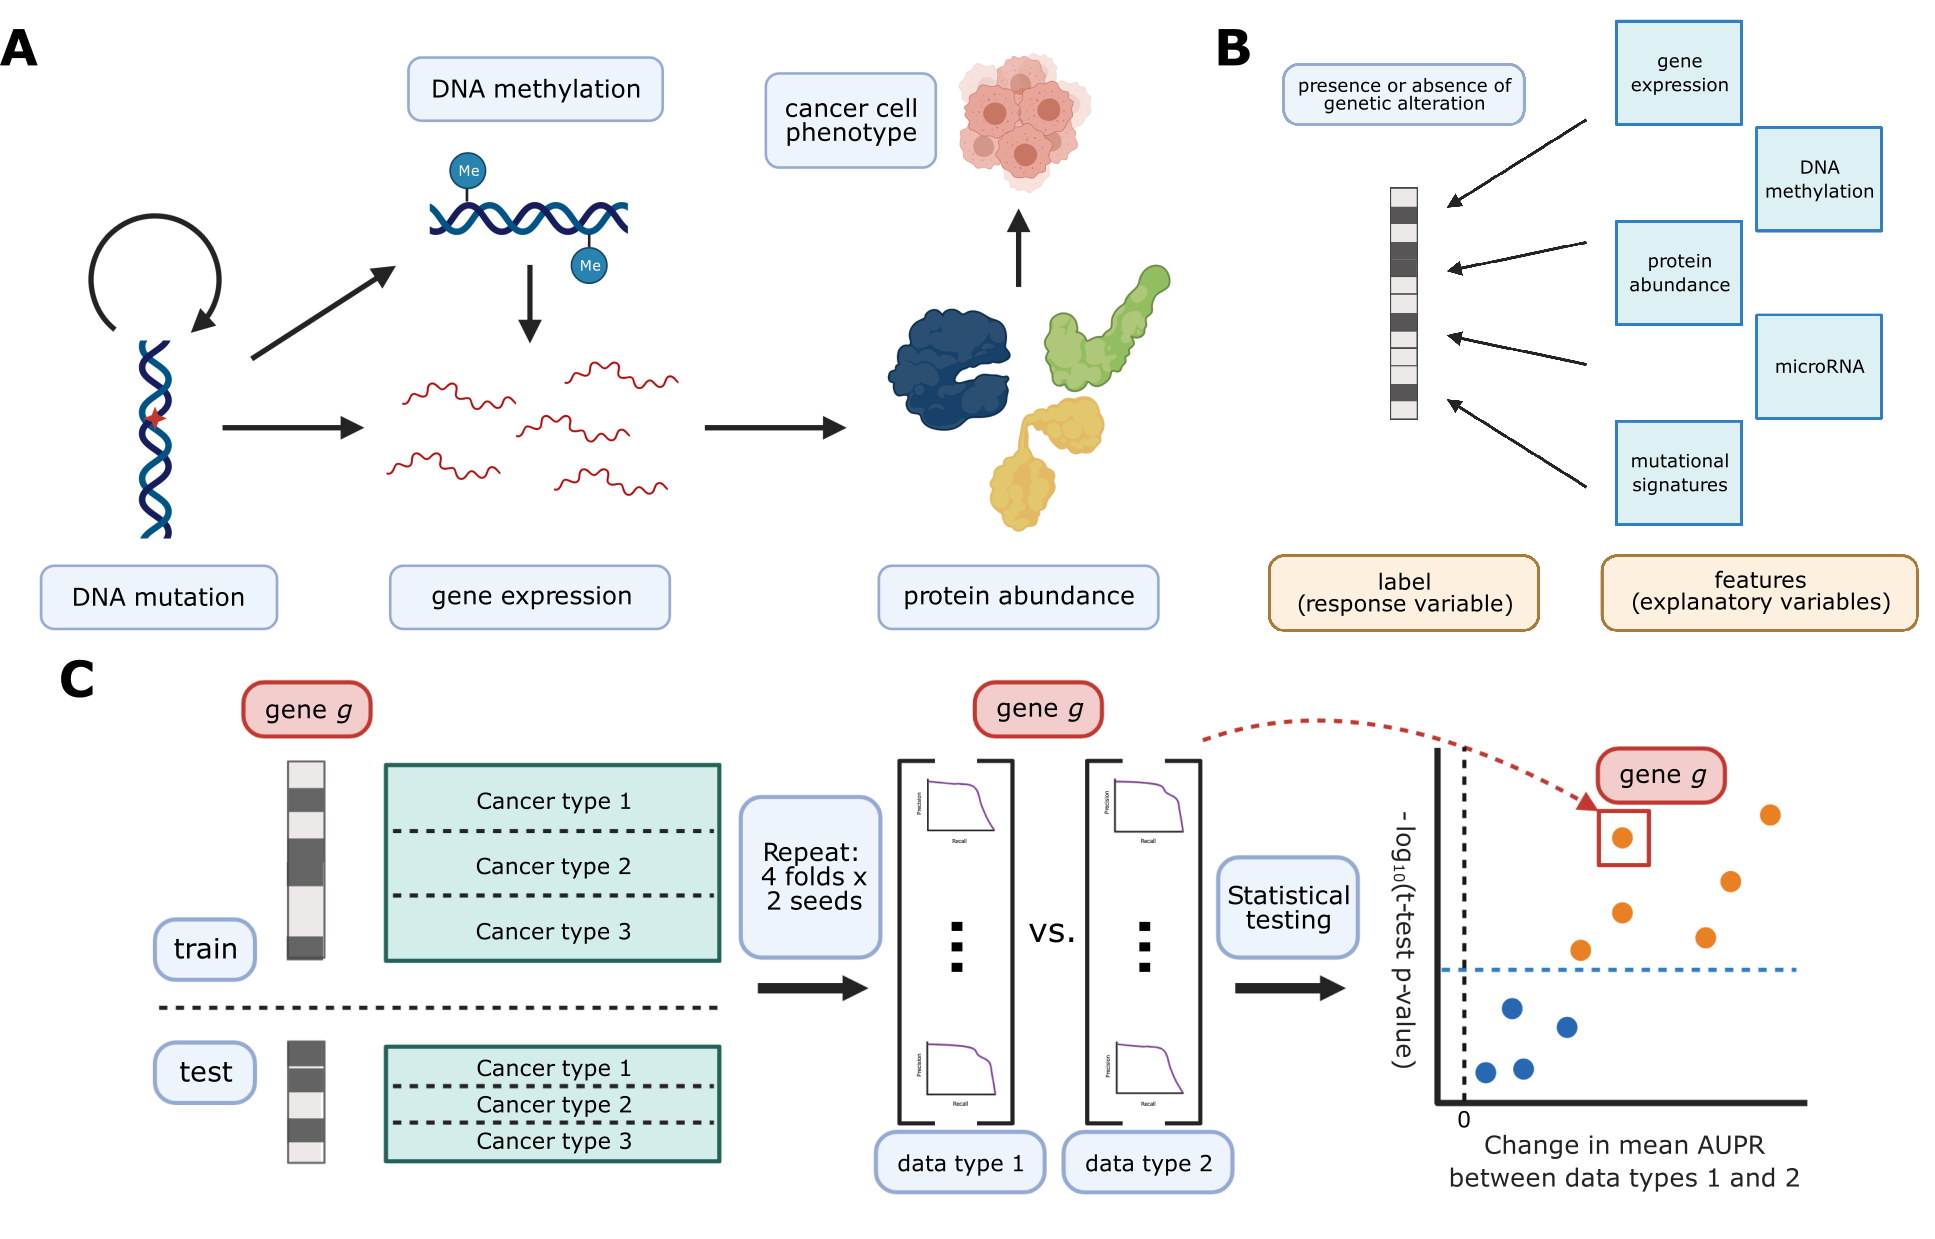
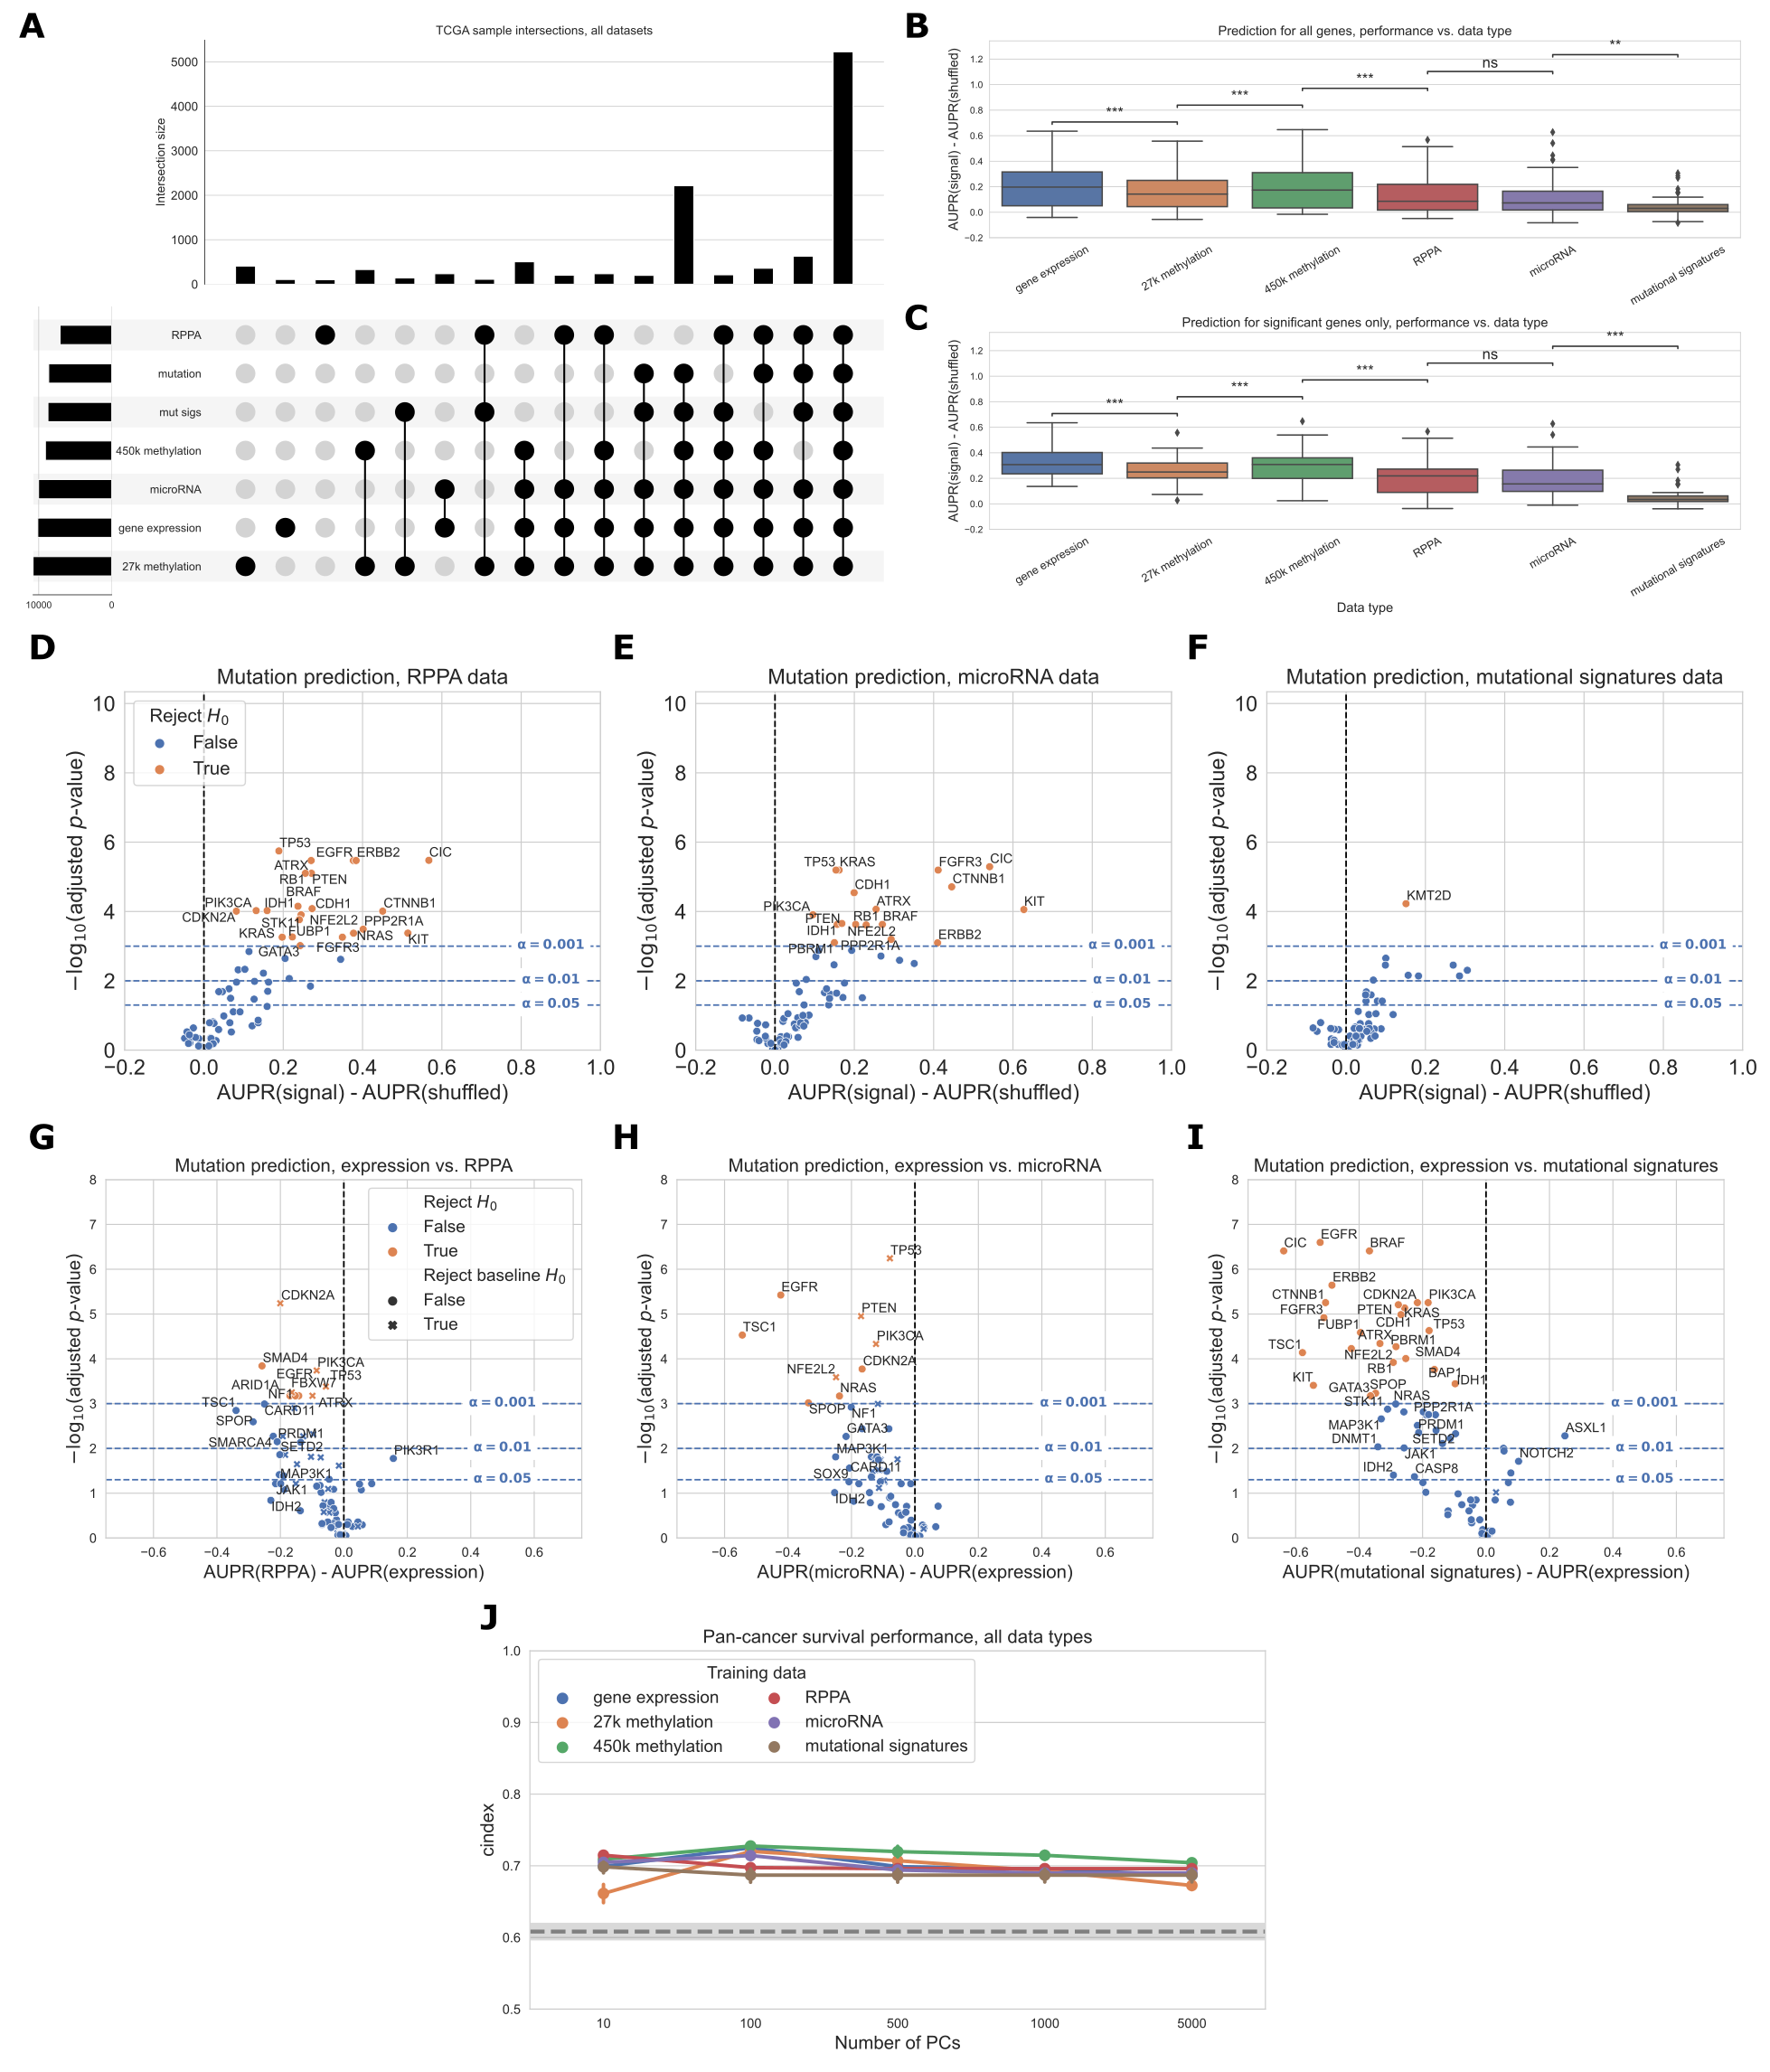
We collected five different data modalities from cancer samples in the TCGA Pan-Cancer Atlas, capturing five steps of cellular function that are perturbed by genetic alterations in cancer (Figure 1A).
These included gene expression (RNA-seq data), DNA methylation (27K and 450K Illumina BeadChip arrays), protein abundance (RPPA data), microRNA expression data, and patterns of somatic mutation (mutational signatures).
To link these diverse data modalities to changes in mutation status, we used elastic net logistic regression to predict the presence or absence of mutations in cancer genes, using these readouts as predictive features (Figure 1B).
We evaluated the resulting mutation status classifiers in a pan-cancer setting, preserving the proportions of each of the 33 cancer types in TCGA for eight train/test splits (4 folds x 2 replicates) in each of 85 cancer genes (Figure 1C).
We sought to compare classifiers against a baseline where mutation labels are permuted (to identify genes whose mutation status correlates strongly with a functional signature in a given data type) and also to compare classifiers trained on true labels across different data types (to identify data types that are more or less predictive of mutations in a given gene).
To account for variation between dataset splits in making these comparisons, we treat classification metrics from the eight train/test splits as performance distributions, which we compare using t-tests.
We summarize performance across all genes in our cancer gene set using a similar approach to a volcano plot, in which each point is a gene.
In our summary plots, the x-axis shows the magnitude of the change in the classification metric between conditions, and the y-axis shows the p-value for the associated t-test (Figure 1C).
Figure 1:A. Cancer mutations can perturb cellular function via a variety of cellular processes.
Arrows represent major potential paths of information flow from a somatic mutation in DNA to its resulting cell phenotype; circular arrow represents the ability of certain mutations (e.g. in DNA damage repair genes) to alter somatic mutation patterns.
Note that this does not reflect all possible relationships between cellular processes: for instance, changes in gene expression can lead to changes in somatic mutation rates.
B. Predicting presence/absence of somatic alterations in cancer from diverse data modalities.
In this study, we use functional readouts from TCGA as predictive features and the presence or absence of mutation in a given gene as labels.
This reverses the primary direction of information flow shown in Panel A.
C. Schematic of evaluation pipeline.
Selection of cancer-related genes improves predictive signal
As a baseline, we evaluated prediction of mutation status from gene expression data across several different gene sets.
Past work has evaluated mutation prediction for the top 50 most mutated genes in TCGA [13], and we sought to extend this to a broader list of gene sets.
We compared a set of cancer-related genes (n=85) from Vogelstein et al. 2013 [34] with an equal number of random genes (n=85) and an equal number of the most mutated genes in TCGA (n=85).
For all gene sets, we used only the set of TCGA samples for which both gene expression and somatic mutation data exists, resulting in a total of 9,074 samples across all 33 cancer types.
This set of samples was further filtered for each target gene to cancer types containing at least 15 mutated samples and at least 5% of samples mutated for that cancer type.
We then evaluated the performance for each target gene in each of the three gene sets.
Genes from the Vogelstein et al. set were more predictable than randomly chosen genes or those selected by total mutation count (Figure 2A).
In total, for a significance threshold of \(\alpha = 0.001\), 45/85 genes (52.9%) in the Vogelstein et al. gene set are significantly predictable from gene expression data, compared to 9/85 genes (10.6%) in the random gene set and 7/85 genes (8.24%) in the most mutated gene set.
Of the nine significantly predictable genes in the random gene set, eight of them are also in the Vogelstein gene set (highlighted in red in Figure 2B), and of the seven significantly predictable genes in the most mutated gene set, all seven of them are also in the Vogelstein gene set (highlighted in red in Figure 2C).
These results suggest that selecting target genes for mutation prediction based on prior knowledge of their involvement in cancer pathways and processes, rather than randomly or based on mutation frequency alone, can improve predictive signal and identify more highly predictable mutations from gene expression data.
Figure 2:A. Overall distribution of performance across three gene sets, using gene expression (RNA-seq) data to predict mutations.
Each data point represents the mean cross-validated AUPR difference, compared with a baseline model trained on permuted mutation presence/absence labels, for one gene in the given gene set; notches show bootstrapped 95% confidence intervals.
“random” = 85 random genes, “most mutated” = 85 most mutated genes, “Vogelstein et al.” = 85 cancer related genes from Vogelstein et al. 2013 gene set.
Significance stars indicate results of Bonferroni-corrected pairwise Wilcoxon tests: **: p < 0.01, ***: p < 0.001, ns: not statistically significant for a cutoff of p = 0.05.
B, C, D. Volcano-like plots showing mutation presence/absence predictive performance for each gene in each of the three gene sets.
The x-axis shows the difference in mean AUPR compared with a baseline model trained on permuted labels, and the y-axis shows p-values for a paired t-test comparing cross-validated AUPR values within folds.
Points (genes) marked with an “X” are overlapping between the Vogelstein gene set and either the random or most mutated gene set.
Gene expression and DNA methylation have similar mutation prediction performance
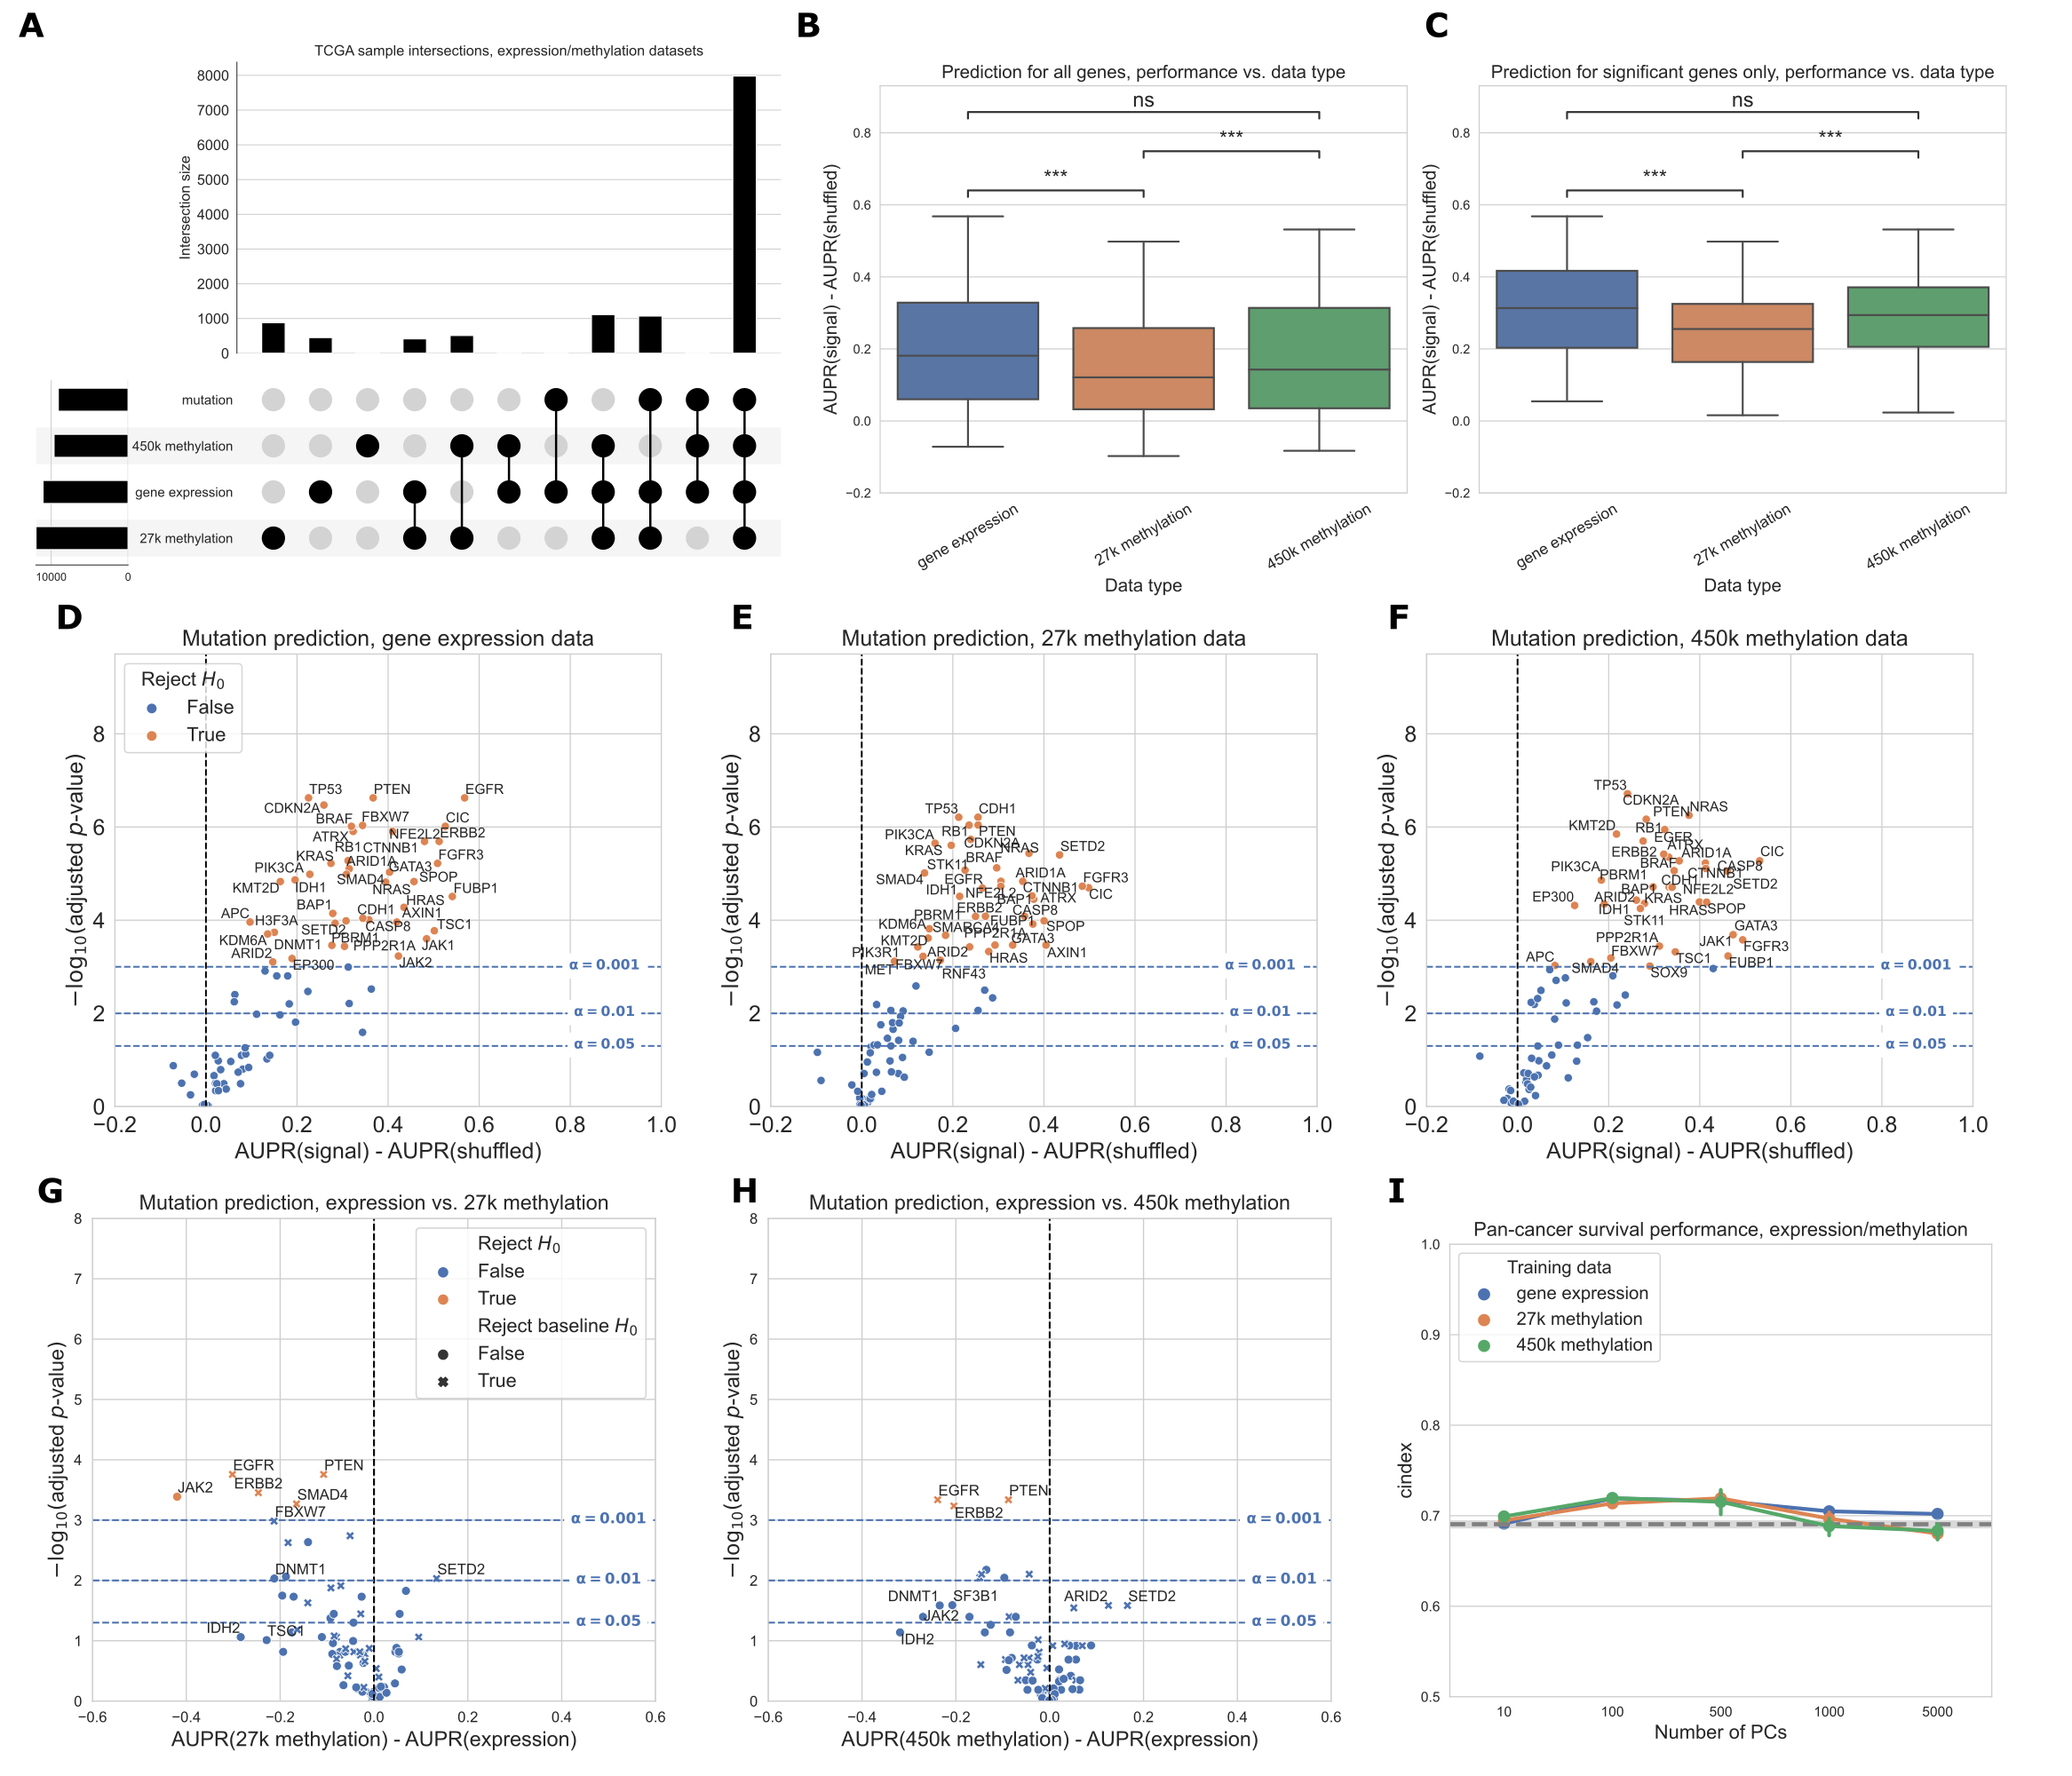
We compared gene expression with DNA methylation as downstream readouts of the effects of cancer alterations.
In these analyses, we considered both the 27K probe and 450K probe methylation datasets generated for the TCGA Pan-Cancer Atlas.
We performed this comparison using the cancer-related gene set derived from Vogelstein et al. [34].
We used samples that had data for each of the data types being compared, including somatic mutation data to generate mutation labels.
This process retained 7,981 samples in the intersection of the expression, 27K methylation, 450K methylation, and mutation datasets, which we used for subsequent analyses.
The most frequent missing data types were somatic mutation data (1,114 samples) and 450K methylation data (1,072 samples) (Figure 3A).
For most genes, predictions are better than our baseline model where labels are permuted (values greater than 0 in the box plots), suggesting that there is considerable predictive signal in both expression and methylation datasets across the Vogelstein et al. gene set (Figure 3B).
Performance distributions are similar for expression and methylation, and aggregate performance is also similar for models using both 8,000 raw features (genes or CpG probes for expression and methylation respectively, selected using mean absolute deviation) or 5,000 principal components.
Both before and after filtering for genes that exceed the significance threshold, gene expression with raw gene features provides a significant performance improvement relative to the 27K methylation dataset, but gene expression and 450K methylation have statistically equivalent performance distributions (Figure 3B, C).
Results were similar with PCA-compressed gene expression features or raw CpG probes as predictors (Supplementary Figure 11).
Considering each target gene in the Vogelstein gene set individually, we observed that 40/84 genes significantly outperformed the permuted baseline using gene expression data, as compared to 38/84 genes for 27K methylation and 37/84 genes for 450K methylation (Figure 3D-F, more information about specific genes in Supplementary Figure 9).
In most cases, these “well-predicted” genes that outperformed the permuted baseline tended to be similar between data types (Figure 3D-F; genes in the top right of each plot).
For example, TP53, BRAF, and PTEN appear in the top right of all 3 plots, suggesting that mutations in these genes have strong gene expression and DNA methylation signatures, and these signatures tend to be preserved across cancer types.
In addition to comparing mutation classifiers trained on different data types to the permuted baseline, we also compared classifiers trained on true labels directly to each other, using a similar methodology (Figure 3G-H).
We observed that 5/100 genes were significantly more predictable from expression data than 27K methylation data, and 3/100 genes were significantly more predictable from expression data than 450K methylation data.
In both cases, 0/100 genes were significantly more predictable using the methylation data types.
For both comparisons (expression vs. 27K methylation and expression vs. 450K methylation), we observed that the majority of points were clustered around the origin, indicating that the data types appear to confer similar information about mutation status.
Additionally, many genes near the origin are significantly predictable vs. the permuted-labels baseline (labeled with an “X” in Figure 3G-H), but equally predictable between data types (blue shading in Figure 3G-H).
That is, in many cases, matching the gene being studied with the “correct” data modality seems to be unimportant: mutation status has a strong signature which can be extracted from both expression and DNA methylation data roughly equally.
We additionally compared pan-cancer survival prediction performance using principal components derived from each data type; in general, results were comparable across the three data types (Figure 3I).
All data types outperformed the covariate-only baseline (see Methods) for lower numbers of PC features included, although performance was similar to the baseline for higher numbers of PCs.
Confidence intervals between the best- and worst-performing data types overlap at most PC counts (with the exception of gene expression at 5,000 PC features), suggesting that similarly to mutation prediction, the three data types tend to have comparable effectiveness for pan-cancer survival prediction.
Figure 3:A. Count of overlapping samples between gene expression, 27K methylation, 450K methylation, and somatic mutation data used from TCGA.
Only non-zero overlap counts are shown.
Somatic mutation sample information is included because it is needed to generate the mutation presence/absence labels.
B. Predictive performance for genes in the Vogelstein et al. gene set, using each of the three data types as predictors.
The gene expression predictor uses the top 8000 gene features by mean absolute deviation, and the methylation predictors use the top 5000 principal components as predictive features.
Significance stars indicate results of Bonferroni-corrected pairwise Wilcoxon tests: **: p < 0.01, ***: p < 0.001, ns: not statistically significant for a cutoff of p = 0.05.
C. Predictive performance for genes where at least one of the considered data types predicts mutation labels significantly better than the permuted baseline.
D-F. Predictive performance for each gene in the Vogelstein et al. gene set, for each data type, compared with a baseline model trained on permuted labels.
G-H. Predictive performance for each gene in the Vogelstein et al. gene set, comparing gene expression directly to each methylation dataset (with classifiers trained on true labels).
I. Pan-cancer survival prediction performance, quantified using c-index on the y-axis, for gene expression, 27K methylation, and 450K methylation. The x-axis shows results with varying numbers of principal components included for each data type. Models also included covariates for patient age, sample mutation burden, and sample cancer type; grey dotted line indicates mean performance for a covariate-only baseline model.
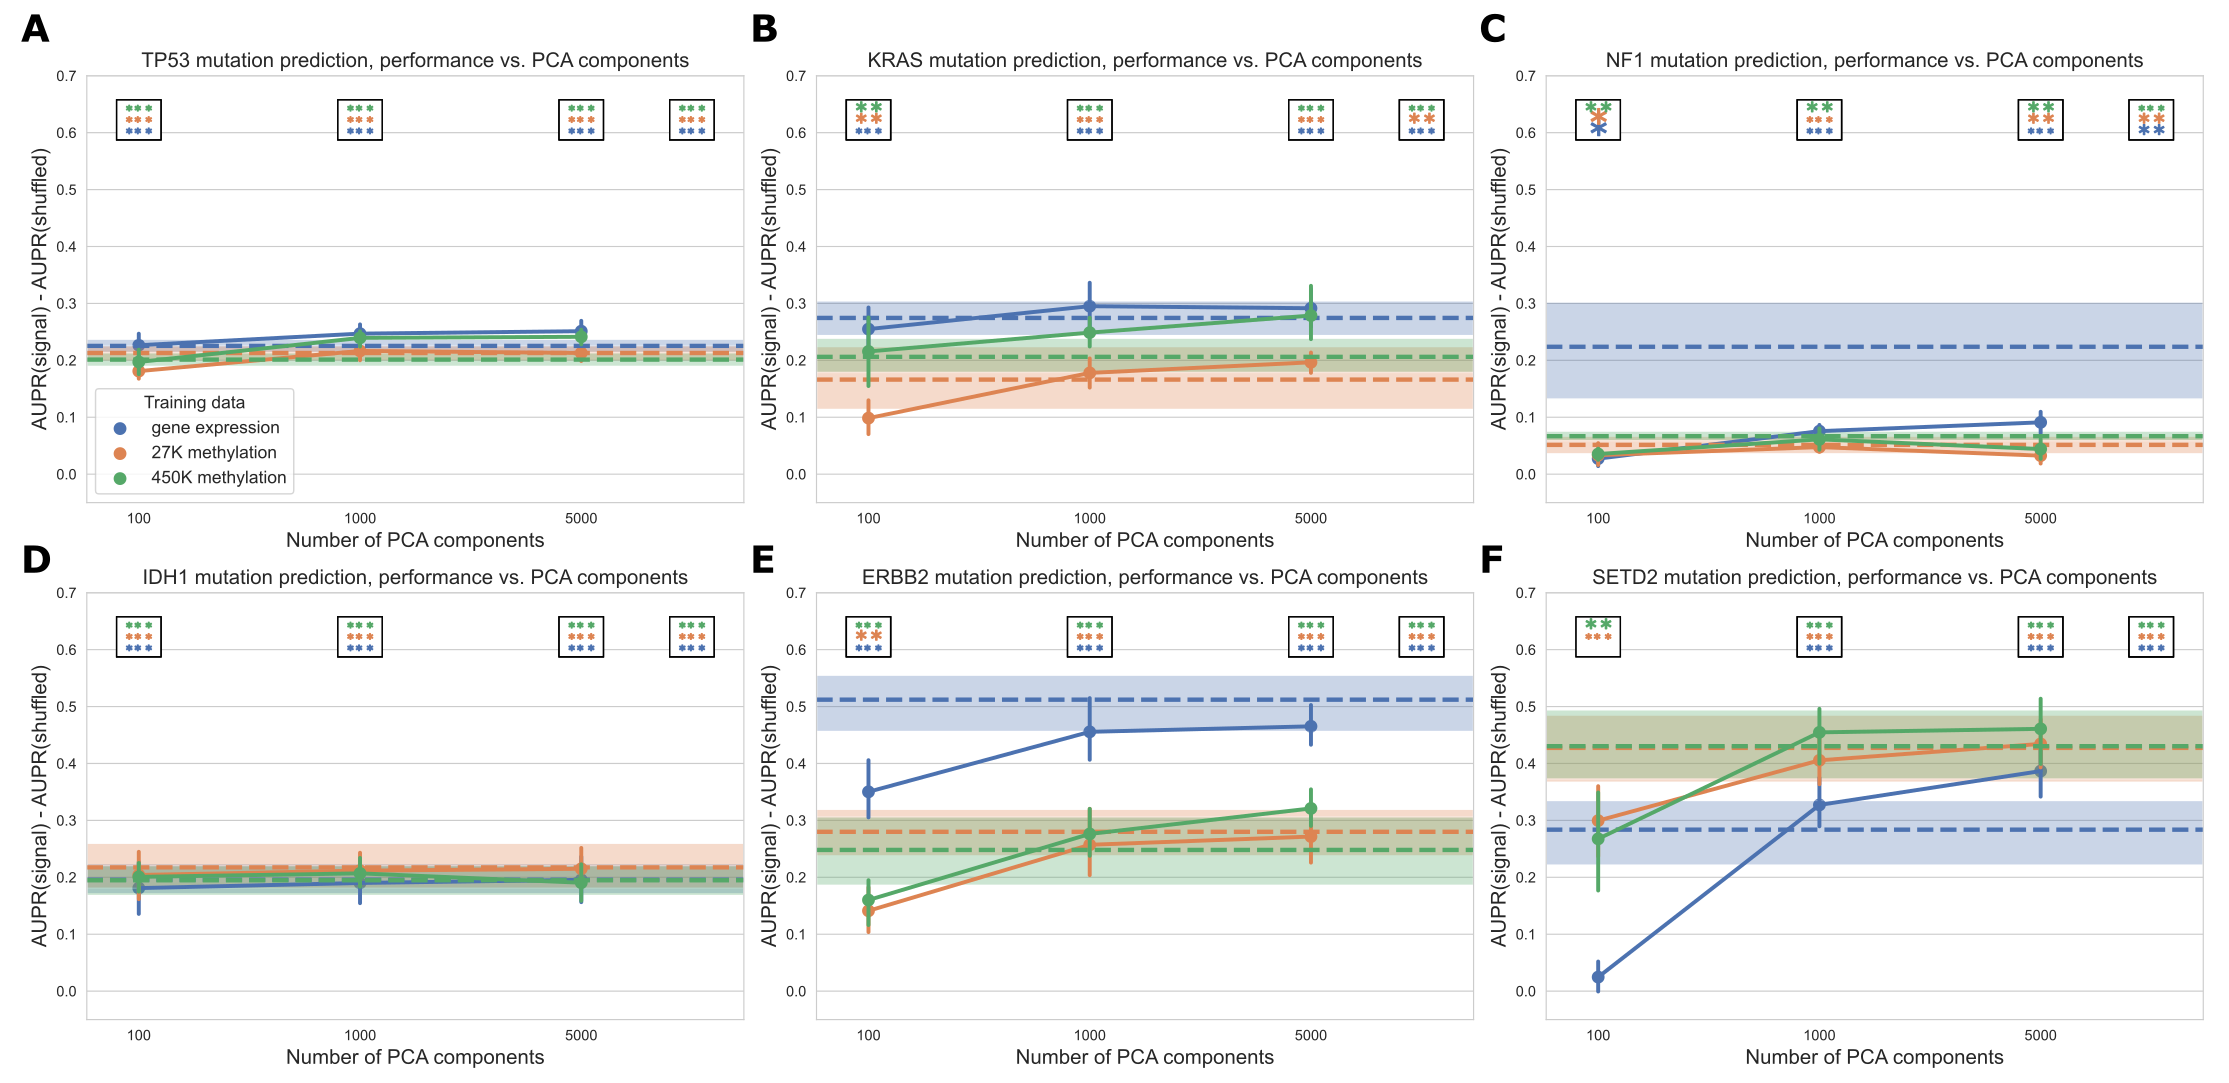
Focusing on several selected genes of interest, we observed that relative classifier performance varies by gene (Figure 4).
Past work has indicated that mutations in TP53 are highly predictable from gene expression data [11], and we observed that the methylation datasets provided similar predictive performance (Figure 4A).
Similarly, for IDH1 both expression and methylation features result in similar performance, consistent with the previously observed role of IDH1 in regulating both DNA methylation and gene expression (Figure 4D) [48].
Mutations in KRAS and ERBB2 (HER2) were most predictable from gene expression data, and in both cases the methylation datasets significantly outperformed the baseline as well (Figure 4B and 4E).
Gene expression signatures of ERBB2 alterations are historically well-studied in breast cancer [49], and samples with activating ERBB2 mutations have recently been shown to share sensitivities to some small-molecule inhibitors across cancer types [50].
These observations are consistent with the pan-cancer ERBB2 mutant-associated expression signature that we observed in this study.
NF1 mutations were also most predictable from gene expression data, although the gene expression-based NF1 mutation classifier did not significantly outperform the baseline with permuted labels at a cutoff of \(\alpha = 0.001\) (Figure 4C).
SETD2 is an example of a gene that is more predictable from the methylation datasets than from gene expression, although gene expression with raw gene features significantly outperformed the permuted baseline as well (Figure 4F).
SETD2 is widely mutated across cancer types and affects H3K36 histone methylation most directly, but SETD2-mediated changes in H3K36 methylation have been linked to dysregulation of diverse cellular processes including DNA methylation and RNA splicing [23,51].
Figure 4: Performance across varying PCA dimensions for specific genes of interest. Dotted lines represent results for “raw” features (8,000 gene features for gene expression data and 8,000 CpG probes for both methylation datasets, selected by largest mean absolute deviation). Error bars and shaded regions show bootstrapped 95% confidence intervals. Stars in boxes show statistical testing results compared with permuted baseline model; each box refers to the model using the number of PCA components it is over (far right box = models with raw features). **: p < 0.01, ***: p < 0.001, no stars: not statistically significant for a cutoff of p = 0.05.
Comparing six different readouts favors expression and DNA methylation
Next, we expanded our comparison to all five functional data modalities (six total readouts, since there are two DNA methylation platforms) available in the TCGA Pan-Cancer Atlas.
As with previous experiments, we limited our comparison to the set of samples profiled for each readout, resulting in 5,226 samples with data for all readouts.
The data types with the most missing samples were RPPA data (2,215 samples that were missing RPPA data) and 450K methylation (630 samples that were missing 450K methylation data) (Figure 5A).
Summarized over all genes in the Vogelstein et al. dataset, we observed that gene expression and both methylation datasets tended to produce similar quality predictions, and these were significantly better than the remaining data types (Figure 5B).
For the set of genes having at least one significant predictor (i.e. “well-predicted” genes), median performance using gene expression was slightly higher than for the methylation data types, although this difference was not statistically significant (Figure 5C).
On the individual gene level, mutations in 22/75 genes were significantly predictable from RPPA data relative to the permuted baseline, compared to 17/75 genes from microRNA data and 1/75 genes from mutational signatures data (Figure 5D-F).
For the remaining data types on this smaller set of samples, 35/75 genes outperformed the baseline for gene expression data, 25/75 for 27k methylation, and 32/75 for 450k methylation.
Compared to the methylation experiments (Figure 3), we observed slightly fewer “well-predicted” genes for the expression and methylation datasets here (likely due to the considerably smaller sample size) but relative performance was comparable (Supplementary Figure 10).
Direct comparisons between each added data type and gene expression data showed that RPPA, microRNA and mutational signatures data generally provide similar or worse performance than the remaining data types (Figure 5G-I).
Performance using RPPA data (Figure 5G) is notable because of its drastically smaller dimensionality than the other data types (190 proteins, compared to thousands of features for the expression and methylation data types).
This suggests that each protein abundance measurement provides a high information content, although this is by design as the antibody probes used for the TCGA analysis were selected to cover established cancer-related pathways [52].
Mutations that are more predictable using RPPA data include PIK3R1 and MAP2K1 (Figure 5G), although neither classifier significantly outperforms the permuted baseline.
Both genes are kinases involved in phosphorylation-mediated signal transduction.
The ability of RPPA technology to quantify protein phosphorylation status may thus provide an advantage in identifying mutations in these genes, relative to the other data types we used that cannot directly measure protein phosphorylation.
Similarly, the scope of the features captured by the mutational signatures data we used is limited to single-base substitution signatures; a broader spectrum of possible signatures is described in previous work [26,53] including doublet-substitution signatures, small indel signatures, and signatures of structural variation, but these were not readily available for the TCGA exome sequencing data.
The relatively poor predictive ability of mutational signatures likely stems from a combination of biological and technical factors, as there is no reason to expect that changes in somatic mutation patterns would be directly caused by most cancer driver mutations (excepting, for instance, mutations in genes involved in DNA damage repair and similar processes).
As in the expression/methylation comparison, we also compared pan-cancer survival prediction performance between all six readouts, using the top principal components derived from each data type to ensure comparable information content (Figure 5J).
All six readouts performed comparably for this smaller set of samples, with slightly better performance across PC feature dimensions for the 450K methylation array.
The covariate-only baseline predictor performed considerably worse than it did in the expression/methylation comparisons, with all -omics data types outperforming the baseline predictor at all PC numbers.
Figure 5:A. Overlap of TCGA samples between all data types used in mutation prediction comparisons.
Only overlaps with more than 100 samples are shown.
Somatic mutation sample information is included because it is needed to generate the mutation presence/absence labels.
B. Overall distribution of performance per data type across 75 genes from Vogelstein et al. gene set.
Each data point represents mean cross-validated AUPR difference, compared with a baseline model trained on permuted labels, for one gene; notches show bootstrapped 95% confidence intervals.
Significance stars indicate results of Bonferroni-corrected pairwise Wilcoxon tests: **: p < 0.01, ***: p < 0.001, ns: not statistically significant for a cutoff of p = 0.05.
All pairwise tests were run (and corrected for) but only neighboring test results are shown.
C. Overall performance distribution per data type for genes where the permuted baseline model is significantly outperformed for one or more data types, resulting in a total of 39 genes.
D, E, F. Volcano-like plots showing predictive performance for each gene in the Vogelstein et al. gene set, in each of the added data types (RPPA, microRNA, mutational signatures). The x-axis shows the difference in mean AUPR compared with a baseline model trained on permuted labels, and the y-axis shows p-values for a paired t-test comparing cross-validated AUPR values within folds.
G, H, I. Volcano-like plots comparing predictive performance between data types for each gene in the Vogelstein et al. gene set. The x-axis shows the difference in mean AUPR between gene expression and another data type (positive values = better mean performance using gene expression features), and the y-axis shows p-values for a paired t-test comparing cross-validated AUPR values within folds.
J. Pan-cancer survival prediction performance, quantified using c-index on the y-axis, for all data types. The x-axis shows results with varying numbers of principal components included for each data type. Models also included covariates for patient age, sample mutation burden, and sample cancer type; grey dotted line indicates mean performance for a covariate-only baseline model.
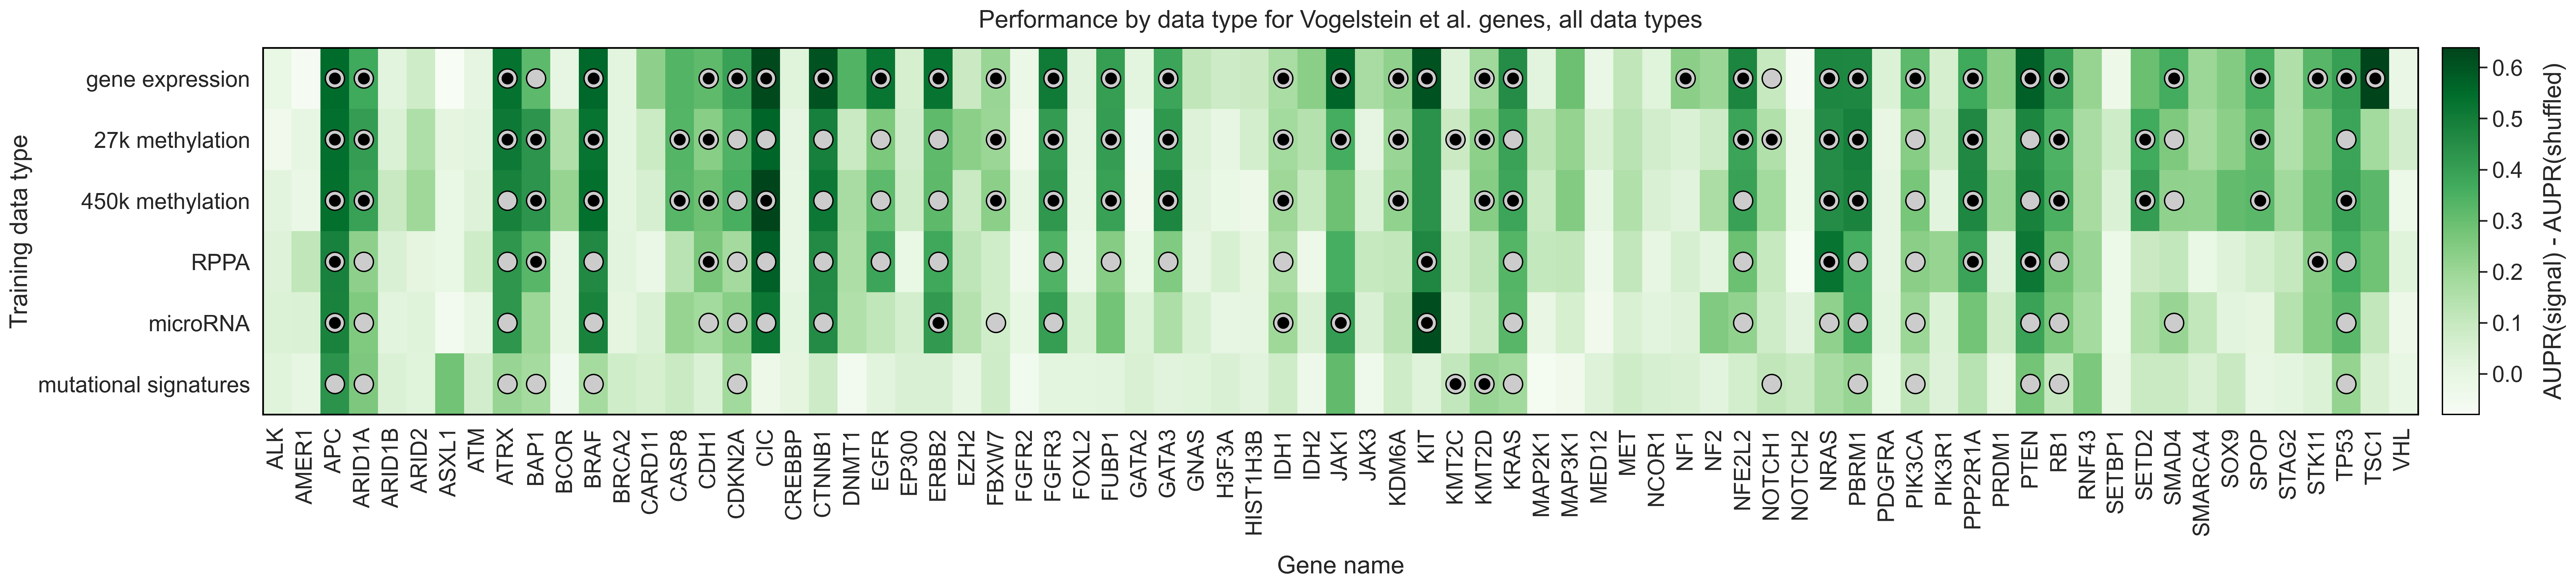
When we constructed a heatmap depicting predictive performance for each gene across data types, we found that very few genes tended to be well-predicted exclusively by one or two data types (Figure 6).
Of the 38 genes that are well-predicted using at least one data type (grey circles in Figure 6), only four of them are well-predicted exclusively by a single data type, meaning that mutations in the other 36 genes can be predicted effectively using at least two different data sources.
This supports our observation that choosing the “correct” data modality is often unimportant for driver genes with strong functional signatures.
Exceptions included NF1 and TSC1 (only well-predicted using gene expression data), and CASP8 and SETD2 (only well-predicted using the two methylation datasets).
Gene expression provided the best performance in 33/38 genes with at least one significant data type (red highlighted boxes in Figure 6), but only 2 of those 33 genes did not have any other significantly predictive data types (NF1 and TSC1); in the other 31 genes one or more non-expression data types also outperformed the permuted baseline.
Figure 6: Heatmap displaying predictive performance for mutations in each of the 75 genes from the Vogelstein et al. gene set, across all six TCGA data modalities. Each cell quantifies performance for a target gene, using predictive features derived from a particular data type. Grey shaded dots indicate that the given data type provides significantly better predictions than the permuted baseline for the given gene; black inner dots indicate the same and additionally that the given data type provides statistically equivalent performance to the data type with the best average performance (determined by pairwise t-tests across data types with FDR correction).
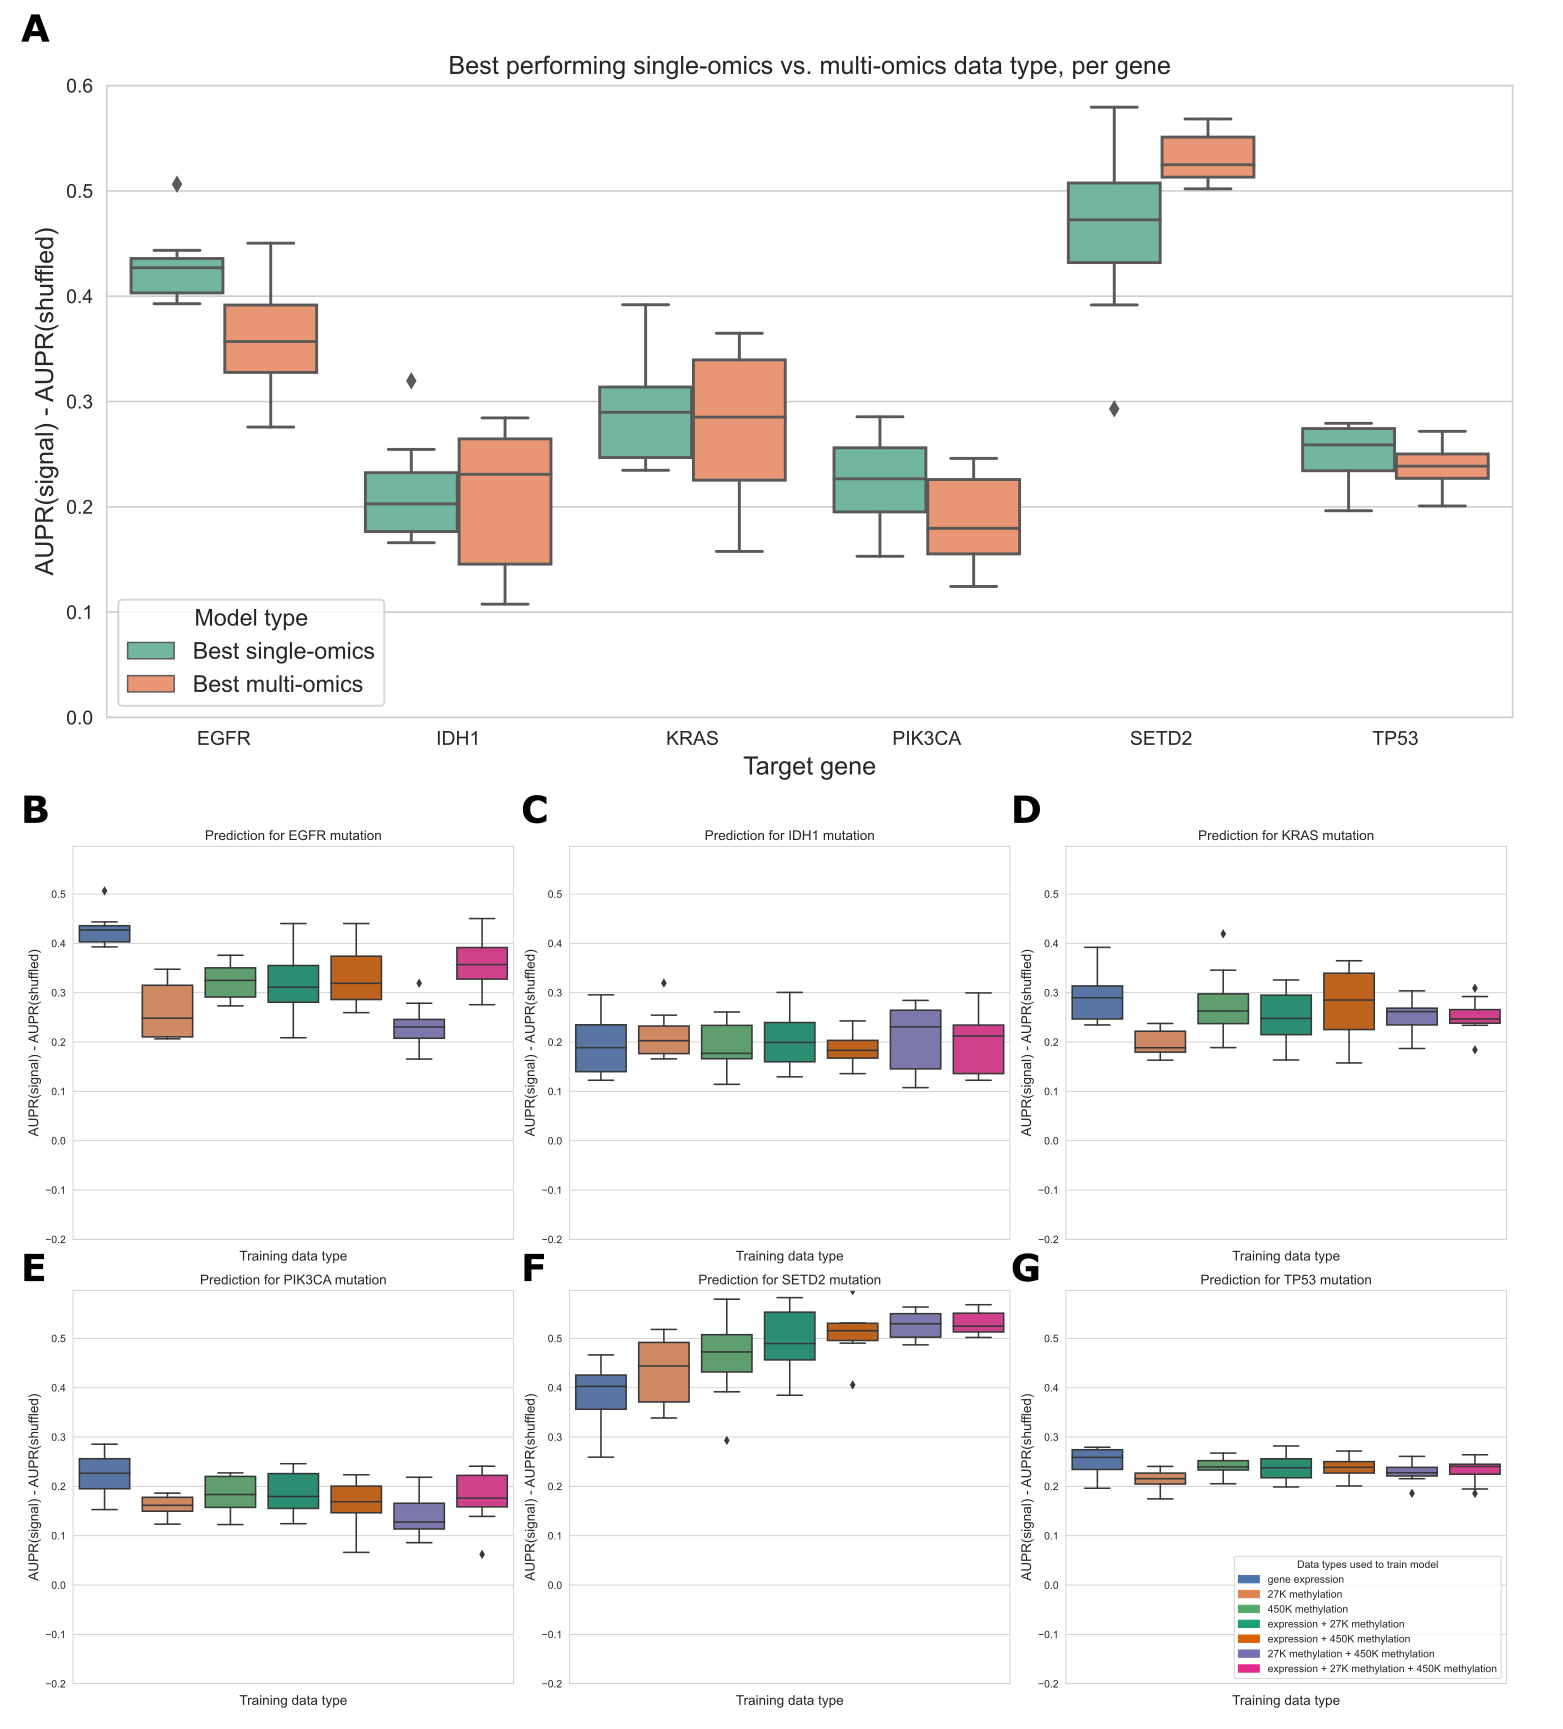
Simple multi-omics integration provides little performance benefit
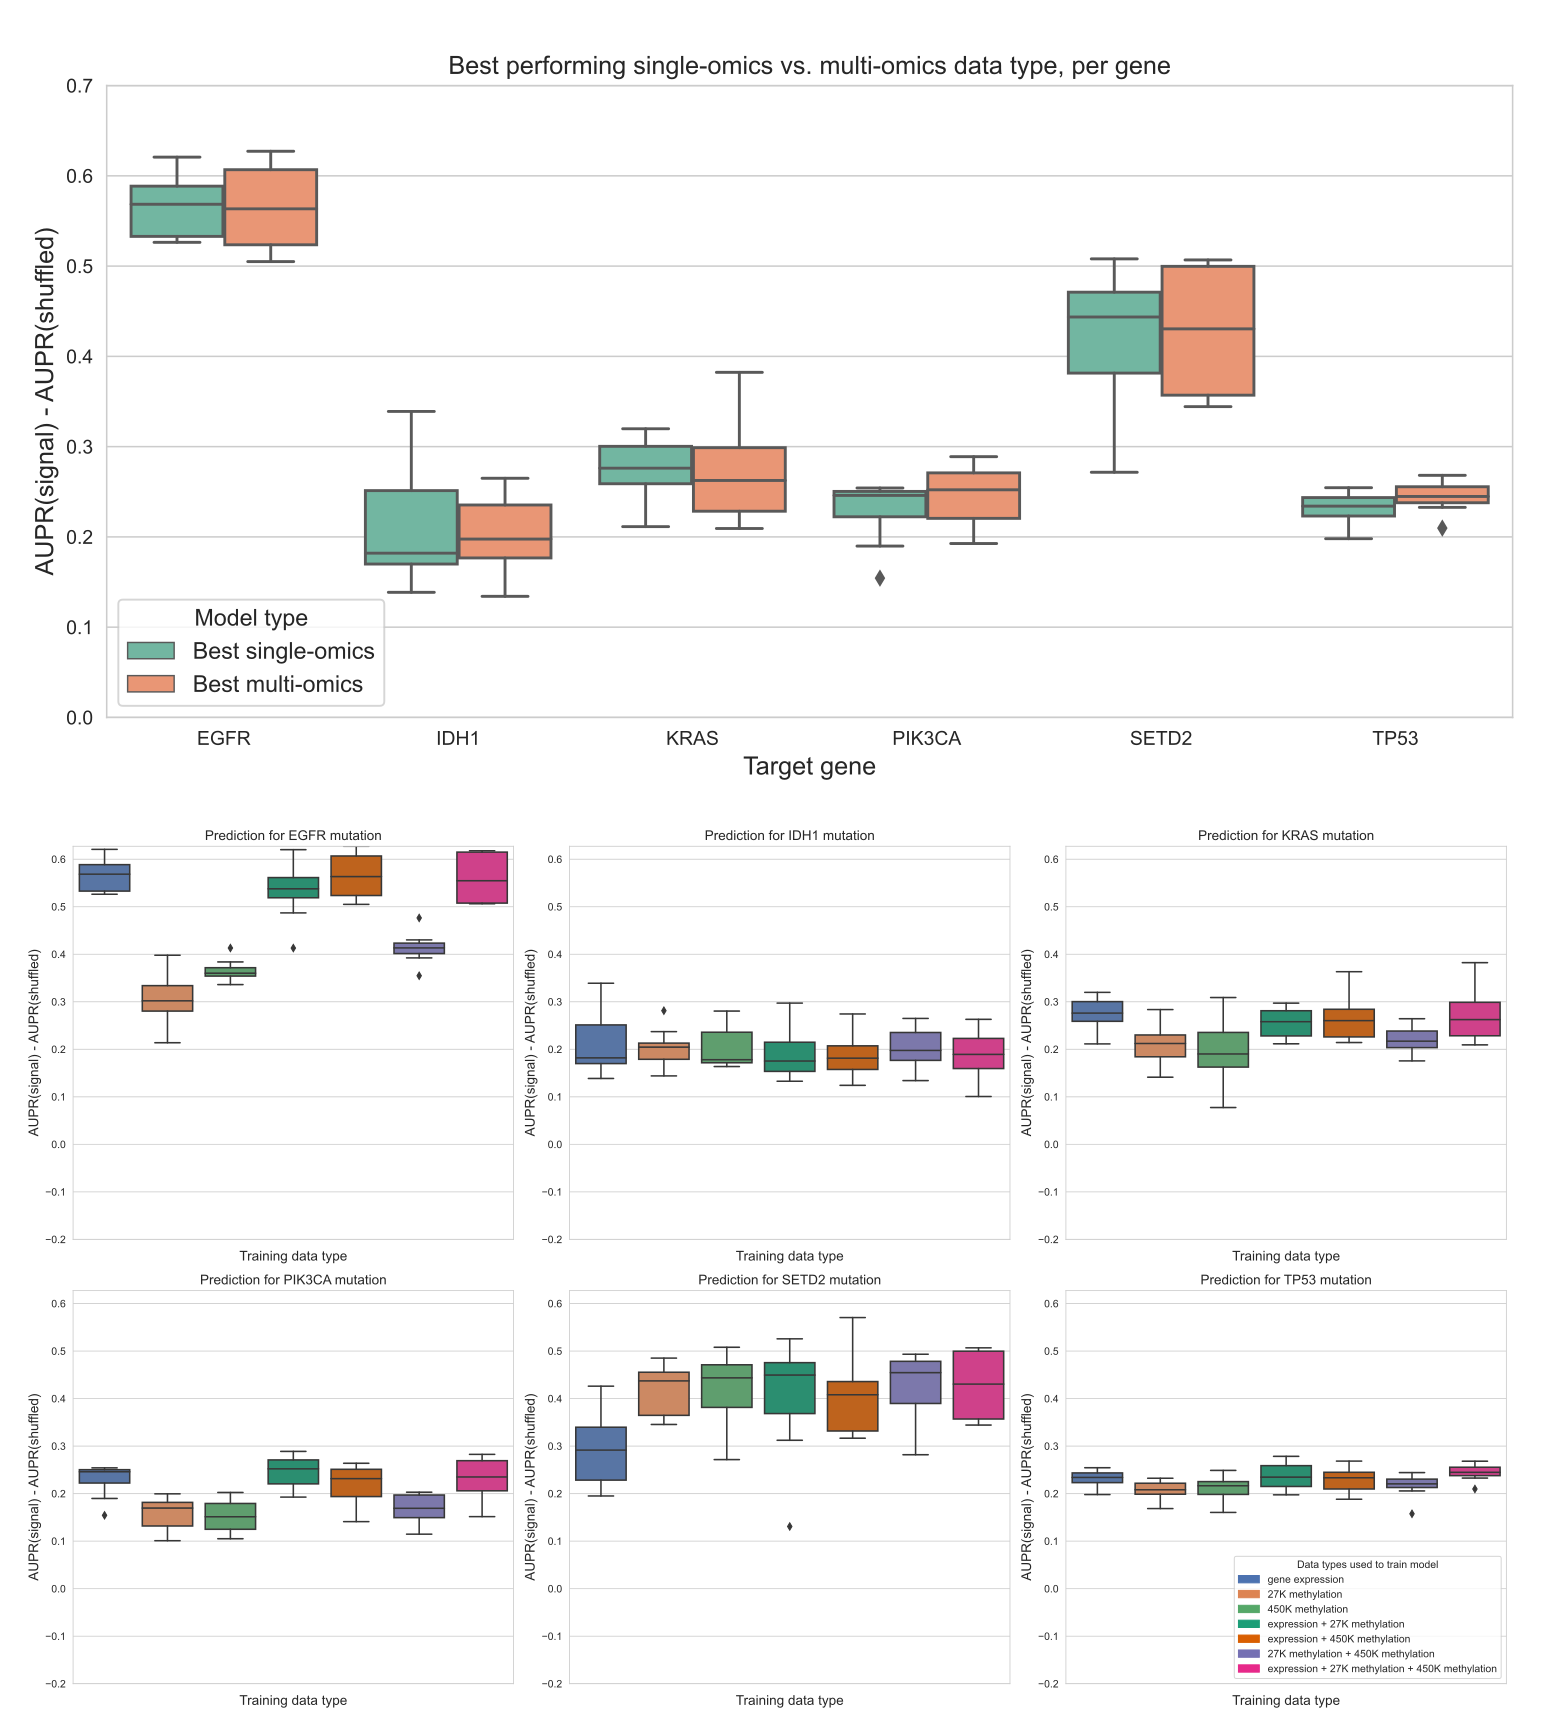
We also trained “multi-omics” classifiers to predict mutations in six well-studied and widely mutated driver genes across various cancer types: EGFR, IDH1, KRAS, PIK3CA, SETD2, and TP53.
Each of these genes is well-predicted from several data types in our earlier experiments (Figure 6), consistent with having strong pan-cancer driver effects.
For the multi-omics classifiers, we considered all pairwise combinations of the top three performing individual data types (gene expression, 27K methylation, and 450K methylation), in addition to a model using all three data types.
We trained a classifier for multiple data types by concatenating features from the individual data types, then fitting the same elastic net logistic regression model as we used for the single-omics models.
Here, we show results using the top 5,000 principal components from each data type as predictive features, to ensure that feature count and scale is comparable among data types; results for raw features are shown in Supplementary Figure 13.
For each of the six target genes, we observed comparable performance between the best single-omics classifier (blue boxes in Figure 7A) and the best multi-omics classifier (orange boxes in Figure 7A).
Across all classifiers and data types, we found varied patterns based on the target gene.
For IDH1 and TP53 performance is relatively consistent regardless of data type(s), suggesting that baseline performance is high and there is little room for improvement as data is added (Figure 7C, G).
The TP53 classifier using raw features showed a statistically significant improvement when multiple data types were integrated, although the difference in mean performance was relatively small (Supplementary Figure 13, p=0.0078).
For EGFR, KRAS, and PIK3CA, combining gene expression with methylation data results in statistically equivalent or worse performance to gene expression alone; classifiers trained only on methylation data generally do not perform as well as those that integrate expression data (Figure 7B, D, E).
Previously, we saw that the best classifiers for SETD2 used methylation data alone (Figure 6).
When we added multiple data types to our SETD2 classifier, we did observe an increase in performance (Figure 7F), although this improvement was not statistically significant in a paired-sample t-test for \(\alpha\)=0.05 (p=0.078).
Overall, we observed that combining data types in a relatively simple manner, by concatenating features from each individual data type, provided little or no improvement in predictive ability over the best individual data type.
This supports our earlier observations of the redundancy of gene expression and methylation data as functional readouts, since our multi-omics classifiers are not in general able to extract gains in predictive performance as more data types are added for this set of cancer drivers.
Figure 7:A. Comparing the best-performing model (i.e. highest mean AUPR relative to permuted baseline) trained on a single data type against the best “multi-omics” model for each target gene. None of the differences between single-omics and multi-omics models were statistically significant using paired-sample Wilcoxon tests across cross-validation folds, for a threshold of 0.05.
B-G. Classifier performance, relative to baseline with permuted labels, for mutation prediction models trained on various combinations of data types. Each panel shows performance for one of the six target genes; box plots show performance distribution over 8 evaluation sets (4 cross-validation folds x 2 replicates).
Discussion
We carried out a large-scale comparison of data types in the TCGA Pan-Cancer Atlas as functional readouts of genetic alterations in cancer, integrating results across cancer types and across driver genes.
Overall, we found that gene expression and DNA methylation capture signatures of mutation state equally effectively in most cases, and that other data types (RPPA, microRNA, mutational signatures) were less effective at predicting mutation presence or absence.
For pan-cancer survival prediction, we found that the functional readouts tended to be similarly effective, outperforming a simple baseline using age and sample mutation burden in most cases.
Our multi-omics modeling experiment indicated that the mutation state information captured by gene expression and DNA methylation is highly redundant, as added data types resulted in no gain or modest gains in classifier performance.
Comparing mutation status prediction using raw and PCA compressed expression and DNA methylation data, we observed that feature extraction using PCA provided no benefit compared to using raw gene or CpG probe features.
Other studies using DNA methylation array data have found that nonlinear dimension reduction methods, such as variational autoencoders and capsule networks, can be effective for extracting predictive features [54,55].
The latter approach is especially interesting because capsule networks and “capsule-like methods” can be constrained to extract features that align with known biology (i.e. that correspond to known disease pathways or CpG site annotations).
This can improve model interpretability as well as predictive performance.
Similar methods have been applied to extract biologically informed features from gene expression data (see, for instance, [56,57]).
A more comprehensive study of dimension reduction methods in the context of mutation prediction, including the features selected by these methods and their biological relevance and interpretation, would be a beneficial area of future work.
In contrast to many other studies demonstrating the benefits of integrating multiple -omics data types for various cancer-related prediction problems [58,59,60,61,62], we found that combining multiple data types to predict mutation status was generally not effective for this problem.
The method we used to integrate different data types by concatenating feature sets is sometimes referred to as “early” data integration (discussed in more detail in [63] and [64]).
It is possible that more sophisticated data integration methods, such as “intermediate” integration methods that learn a set of features jointly across datasets, would produce improved predictions.
We do not interpret our results as concrete evidence that multi-omics integration is not effective for this problem; rather, we see them as an indication that this is a challenging data integration problem for which further investigation is needed.
We also present this problem as a set of benchmark tasks on which multi-omics integration methods can be evaluated.
In addition to the methodological questions, the issue of data integration also has implications for the underlying biology: a more nuanced understanding of when different data readouts provide redundant information, and when they can contribute unique information about cancer pathology and development, could have many translational applications.
One limitation of the current study is that, for the mutation prediction problem, we only evaluated classifiers that were trained on pan-cancer data.
Considering every possible combination of target gene and TCGA cancer type (85 target genes x 33 cancer types x 6 data types) would have drastically increased the computational load and presented a large multiple testing burden.
Alternatively, choosing only a subset of gene/cancer type combinations to study would have biased our results toward known driver gene/cancer type relationships, which we aimed to avoid.
In future work it would be interesting to identify classifiers that perform well in a certain cancer type but not in the pan-cancer context and to compare these instances across different cancer types.
As a motivating example, other studies have shown that activating mutations in Ras isoforms (HRAS, KRAS, NRAS) tend to have similar effects to one another in thyroid cancer, producing similar gene expression signatures [15].
In multiple myeloma, however, activating KRAS and NRAS mutations produce distinct expression signatures, necessitating separate classifiers [65].
A high-throughput computational pipeline to identify cases where functional signatures of a particular cancer driver are either concordant or discordant between cancer types could identify opportunities for context-specific protein function prediction, improve biomarker identification, and suggest cases where drugs targeting specific alterations might produce discordant results in different cancer types.
As with any study relying on observational, cross-sectional data such as the TCGA Pan-Cancer Atlas, the conclusions that we can draw are limited by the data.
In particular, for any of our “well-predicted” genes (i.e. genes that, when mutated, have strong signatures in one or more data types), we cannot definitively distinguish correlation from causation.
To directly assess the effects of particular mutations on various data modalities, some studies use cell line data from sources such as the Cancer Cell Line Encyclopedia (CCLE) [66].
While this approach could help to isolate the causal effect of a given mutation on a given cell line, cell lines are sometimes an imperfect match for the cancers they are derived from [67].
We are also limited in that we cannot assign timing or clonal status to mutations, or fully characterize intratumor heterogeneity, with certainty from the bulk sequencing data generated by TCGA (although some features of tumor mutational processes over time can be estimated from bulk data, e.g. [68]).
As methods for generating large longitudinal datasets at single-cell resolution mature and scale, we will need to revise the way we think about cellular function and dysregulation in cancer cells, as dynamic and adaptive processes rather than a single representative snapshot of a tumor.
Based on our results, for studies focused on the functional consequences of cancer mutations, we recommend that researchers designing large-scale studies aiming to understand the regulatory state of cancers prioritize gene expression or DNA methylation as downstream readouts.
On balance, prediction of mutation status was slightly better using gene expression data, and prediction of patient survival was similar using both data types.
However, the finding that DNA methylation profiles contain much of the same information will be useful for some study designs, given the varying stability of mRNA across storage methods and times.
Results using RPPA measurements as predictive features were also promising, especially considering the substantially lower dimensionality of the RPPA dataset compared to other data types.
Future technology advances, in both quality and quantity of data, are likely to improve our understanding of the full picture of functional consequences of mutations in cancer cells.
Declarations
Ethics approval and consent to participate
Not applicable
Consent for publication
Not applicable
Availability of data and materials
The datasets analyzed during this study were previously published as part of the TCGA Pan-Cancer Atlas project, and are publicly available from the NIH NCI Genomic Data Commons (GDC) at https://gdc.cancer.gov/about-data/publications/pancanatlas.
Scripts used to download and preprocess the datasets for this study are available at https://github.com/greenelab/mpmp/tree/master/00_download_data.
Competing interests
The authors declare that they have no competing interests.
Funding
This work was supported by grants from the National Institutes of Health’s National Human Genome Research Institute (NHGRI) under award R01 HG010067 to CSG and the National Institutes of Health’s National Cancer Institute (NCI) under awards R01 CA237170 to CSG, R01 CA216265 to BCC, and R01 CA253976 to BCC.
The funders had no role in study design, data collection and analysis, decision to publish, or preparation of the manuscript.
Authors’ contributions
JC: conceptualization, methodology, software, visualization, writing - original draft, writing - review and editing
BCC: methodology, writing - review and editing
MC: methodology, writing - review and editing
CSG: conceptualization, funding acquisition, methodology, supervision, writing - review and editing
Acknowledgements
We would like to thank Alexandra Lee, Ben Heil, Milton Pividori, and Natalie Davidson for reviewing the software associated with this work and providing insightful feedback.
Figure 1 (the schematic of the background and evaluation pipeline) was created using BioRender.com.
Supplementary Information
A version of the main paper figures using the area under the receiver-operator curve (AUROC) metric rather than AUPR is available at https://doi.org/10.6084/m9.figshare.14919729.
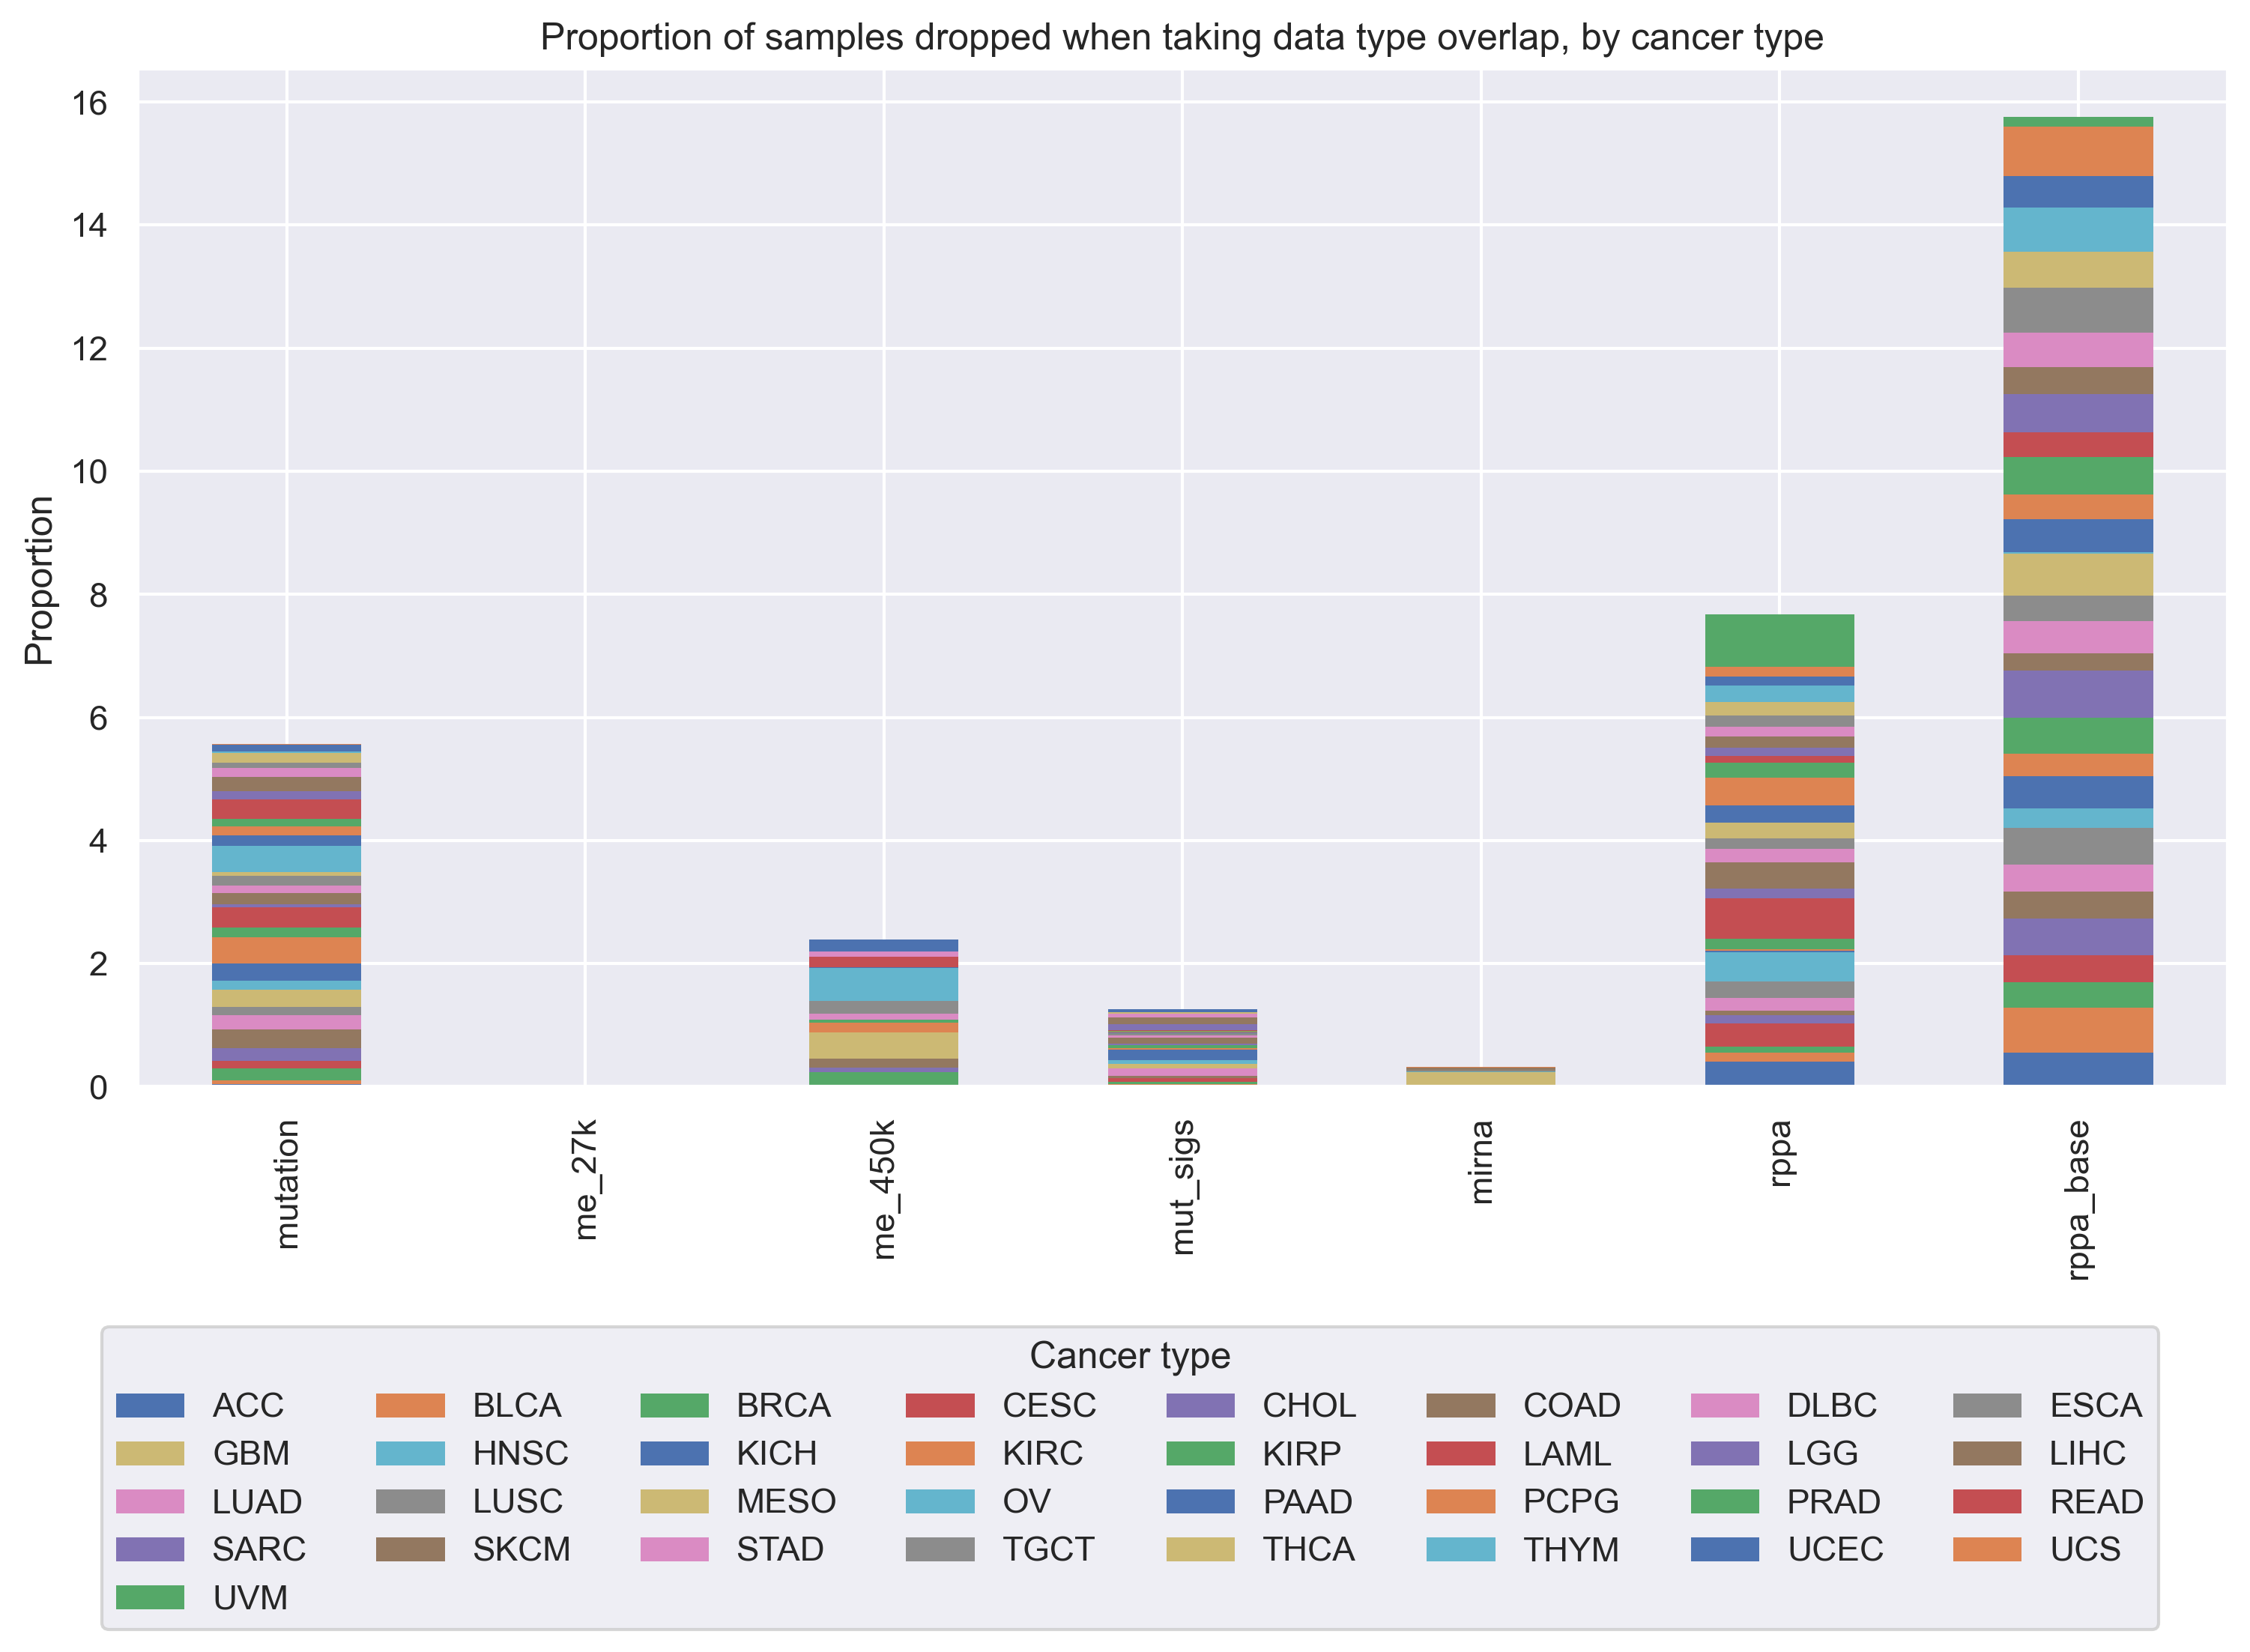
Figure 8: Proportion of samples from each TCGA cancer type that are “dropped” as more data types are added to our analyses. We started with gene expression data, and for each added data type, we took the intersection of samples that were profiled for that data type and the previous data types, dropping all samples that were missing 1 or more data types. Overall, at each step, the proportions of “dropped” samples appear to be fairly evenly spread between cancer types, showing that in general we are not disproportionately losing one or several cancer types as more data modalities are added to our analyses.
Table 1: Number of samples from each TCGA cancer type that are “dropped” as more data types are added to the analysis. The “base” column indicates the number of samples that are present per cancer type in the final intersection of all data types (i.e. each sample counted in the last column has data for each of the 7 data types, including gene expression (not listed here) and somatic mutations).
cancer type
mutation
me_27k
me_450k
mut_sigs
mirna
rppa
base
ACC
3
0
0
0
0
32
44
BLCA
29
0
0
20
3
65
310
BRCA
237
16
291
44
9
109
512
CESC
38
0
0
18
0
120
134
CHOL
9
0
3
0
0
6
27
COAD
154
0
77
15
0
33
216
DLBC
11
0
0
6
0
10
21
ESCA
27
0
0
0
0
53
116
GBM
48
0
73
12
39
0
0
HNSC
79
0
0
39
3
267
178
KICH
26
0
0
15
0
2
48
KIRC
254
0
97
16
0
18
221
KIRP
52
0
13
17
0
53
188
LAML
58
1
0
0
0
114
0
LGG
23
0
1
8
4
85
409
LIHC
75
0
1
46
2
179
120
LUAD
74
1
56
20
1
125
299
LUSC
89
1
113
21
4
94
231
MESO
5
0
0
0
0
23
59
OV
132
2
166
0
0
0
8
PAAD
31
0
2
2
0
51
97
PCPG
26
0
0
1
0
83
77
PRAD
71
0
0
10
4
134
331
READ
53
0
29
1
0
20
68
SARC
36
0
0
28
1
33
167
SKCM
111
0
0
52
14
92
205
STAD
67
0
40
25
0
67
251
TGCT
12
0
0
0
0
30
114
THCA
92
0
1
16
1
124
338
THYM
3
0
0
0
0
32
87
UCEC
60
0
109
22
0
84
292
UCS
1
0
0
0
1
9
46
UVM
0
0
0
0
0
68
12
Figure 9: Heatmap displaying predictive performance for mutations in each of the 84 genes from the Vogelstein et al. gene set, across gene expression and the two DNA methylation arrays. Each cell quantifies performance for a target gene, using predictive features derived from a particular data type. Grey shaded dots indicate that the given data type provides significantly better predictions than the permuted baseline for the given gene; black inner dots indicate the same and additionally that the given data type provides statistically equivalent performance to the data type with the best average performance (determined by pairwise t-tests across data types with FDR correction).
Figure 10: Volcano-like plots showing predictive performance for each gene in the Vogelstein et al. gene set for expression and DNA methylation, on the sample set used for the “all data types” experiments. The first row shows performance relative to the permuted baseline, and the second row shows direct comparisons between data types. The x-axis shows the difference in mean AUPR compared with a baseline model trained on permuted labels, and the y-axis shows p-values for a paired t-test comparing cross-validated AUPR values within folds.
Figure 11: Predictive performance for genes in the Vogelstein et al. gene set, using each of the three data types as predictors.
The x-axis shows the number of PCA components used as features, “raw” = no PCA compression.
Figure 12: Survival prediction performance for top 10 PCA components, for individual cancer types.
The top row shows the five cancer types with the highest average coefficient of variation across data types, for expression, 27K methylation, and 450K methylation.
The bottom row shows the five cancer types with the highest average coefficient of variation across data types, for the comparison using all 6 data types.
Each box plot displays the c-index distribution across 8 performance measurements (2 cross-validation replicates x 4 folds).
The grey dotted line shows mean performance for a model using only non-omics covariates (patient age at diagnosis and log10(sample mutation count)); grey shaded area indicates bootstrapped 95% confidence interval.
Figure 13: Top plot: comparing the best-performing model (i.e. highest mean AUPR relative to permuted baseline) trained on a single data type against the best “multi-omics” model for each target gene, using raw (not PCA compressed) features. For feature parity between data types, the top 20,000 features by mean absolute deviation were used for each data type.
The difference between single-omics and multi-omics performance for TP53 was statistically significant (p=0.0078), but other differences between single-omics and multi-omics models were not statistically significant using paired-sample Wilcoxon tests across cross-validation folds, for a threshold of 0.05.
Bottom plots: classifier performance, relative to baseline with permuted labels, for individual genes. Each panel shows performance for one of the six target genes; box plots show performance distribution over 8 evaluation sets (4 cross-validation folds x 2 replicates).
References
1. Oncogenic Signaling Pathways in The Cancer Genome Atlas
Francisco Sanchez-Vega, Marco Mina, Joshua Armenia, Walid K. Chatila, Augustin Luna, Konnor C. La, Sofia Dimitriadoy, David L. Liu, Havish S. Kantheti, Sadegh Saghafinia, … Armaz Mariamidze Cell (2018-04) https://doi.org/gc7r9b
DOI: 10.1016/j.cell.2018.03.035 · PMID: 29625050 · PMCID: PMC6070353
2. Systematic identification of mutations and copy number alterations associated with cancer patient prognosis
Joan C Smith, Jason M Sheltzer eLife (2018-12-11) https://doi.org/gf4zgg
DOI: 10.7554/elife.39217 · PMID: 30526857 · PMCID: PMC6289580
3. Challenges in identifying cancer genes by analysis of exome sequencing data
Matan Hofree, Hannah Carter, Jason F. Kreisberg, Sourav Bandyopadhyay, Paul S. Mischel, Stephen Friend, Trey Ideker Nature Communications (2016-07-15) https://doi.org/f8x7t3
DOI: 10.1038/ncomms12096 · PMID: 27417679 · PMCID: PMC4947162
4. Evaluating the evaluation of cancer driver genes
Collin J. Tokheim, Nickolas Papadopoulos, Kenneth W. Kinzler, Bert Vogelstein, Rachel Karchin Proceedings of the National Academy of Sciences (2016-12-13) https://doi.org/f9d77w
DOI: 10.1073/pnas.1616440113 · PMID: 27911828 · PMCID: PMC5167163
5. Detailed modeling of positive selection improves detection of cancer driver genes
Siming Zhao, Jun Liu, Pranav Nanga, Yuwen Liu, A. Ercument Cicek, Nicholas Knoblauch, Chuan He, Matthew Stephens, Xin He Nature Communications (2019-07-30) https://doi.org/gjmhnn
DOI: 10.1038/s41467-019-11284-9 · PMID: 31363082 · PMCID: PMC6667447
6. Review: Precision medicine and driver mutations: Computational methods, functional assays and conformational principles for interpreting cancer drivers
Ruth Nussinov, Hyunbum Jang, Chung-Jung Tsai, Feixiong Cheng PLOS Computational Biology (2019-03-28) https://doi.org/gg8jhm
DOI: 10.1371/journal.pcbi.1006658 · PMID: 30921324 · PMCID: PMC6438456
7. The Cancer Genome Atlas Pan-Cancer analysis project
John N Weinstein, Eric A Collisson, Gordon B Mills, Kenna R Mills Shaw, Brad A Ozenberger, Kyle Ellrott, Ilya Shmulevich, Chris Sander, Joshua M Stuart, The Cancer Genome Atlas Research Network Nature Genetics (2013-09-26) https://doi.org/f3nt5c
DOI: 10.1038/ng.2764 · PMID: 24071849 · PMCID: PMC3919969
8. Modeling RAS Phenotype in Colorectal Cancer Uncovers Novel Molecular Traits of RAS Dependency and Improves Prediction of Response to Targeted Agents in Patients
Justin Guinney, Charles Ferté, Jonathan Dry, Robert McEwen, Gilles Manceau, KJ Kao, Kai-Ming Chang, Claus Bendtsen, Kevin Hudson, Erich Huang, … Pierre Laurent-Puig Clinical Cancer Research (2014-01-01) https://doi.org/f5njhn
DOI: 10.1158/1078-0432.ccr-13-1943 · PMID: 24170544 · PMCID: PMC4141655
9. Machine Learning Detects Pan-cancer Ras Pathway Activation in The Cancer Genome Atlas
Gregory P. Way, Francisco Sanchez-Vega, Konnor La, Joshua Armenia, Walid K. Chatila, Augustin Luna, Chris Sander, Andrew D. Cherniack, Marco Mina, Giovanni Ciriello, … Armaz Mariamidze Cell Reports (2018-04) https://doi.org/gfspsb
DOI: 10.1016/j.celrep.2018.03.046 · PMID: 29617658 · PMCID: PMC5918694
10. Identification of pan-cancer Ras pathway activation with deep learning
Xiangtao Li, Shaochuan Li, Yunhe Wang, Shixiong Zhang, Ka-Chun Wong Briefings in Bioinformatics (2021-07) https://doi.org/gjmd3p
DOI: 10.1093/bib/bbaa258 · PMID: 33126245
11. Genomic and Molecular Landscape of DNA Damage Repair Deficiency across The Cancer Genome Atlas
Theo A. Knijnenburg, Linghua Wang, Michael T. Zimmermann, Nyasha Chambwe, Galen F. Gao, Andrew D. Cherniack, Huihui Fan, Hui Shen, Gregory P. Way, Casey S. Greene, … Armaz Mariamidze Cell Reports (2018-04) https://doi.org/gfspsc
DOI: 10.1016/j.celrep.2018.03.076 · PMID: 29617664 · PMCID: PMC5961503
13. Compressing gene expression data using multiple latent space dimensionalities learns complementary biological representations
Gregory P. Way, Michael Zietz, Vincent Rubinetti, Daniel S. Himmelstein, Casey S. Greene Genome Biology (2020-05-11) https://doi.org/gg2mjh
DOI: 10.1186/s13059-020-02021-3 · PMID: 32393369 · PMCID: PMC7212571
14. Systematic interrogation of mutation groupings reveals divergent downstream expression programs within key cancer genes
Michal R. Grzadkowski, Hannah Manning, Julia Somers, Emek Demir Cold Spring Harbor Laboratory (2020-06-18) https://doi.org/gjmd7t
DOI: 10.1101/2020.06.02.128850
15. Using Transcriptional Signatures to Find Cancer Drivers with LURE
David Haan, Ruikang Tao, Verena Friedl, Ioannis N Anastopoulos, Christopher K Wong, Alana S Weinstein, Joshua M Stuart World Scientific Pub Co Pte Ltd (2019-12) https://doi.org/gjmd4t
DOI: 10.1142/9789811215636_0031
16. Reverse regression increases power for detecting trans-eQTLs
Saikat Banerjee, Franco L. Simonetti, Kira E. Detrois, Anubhav Kaphle, Raktim Mitra, Rahul Nagial, Johannes Söding Cold Spring Harbor Laboratory (2020-09-02) https://doi.org/gjmhd8
DOI: 10.1101/2020.05.07.083386
17. Cancer transcriptome profiling at the juncture of clinical translation
Marcin Cieślik, Arul M. Chinnaiyan Nature Reviews Genetics (2017-12-27) https://doi.org/gcsmnr
DOI: 10.1038/nrg.2017.96 · PMID: 29279605
18. Identification of a CpG Island Methylator Phenotype that Defines a Distinct Subgroup of Glioma
Houtan Noushmehr, Daniel J. Weisenberger, Kristin Diefes, Heidi S. Phillips, Kanan Pujara, Benjamin P. Berman, Fei Pan, Christopher E. Pelloski, Erik P. Sulman, Krishna P. Bhat, … Kenneth Aldape Cancer Cell (2010-05) https://doi.org/dbtmsd
DOI: 10.1016/j.ccr.2010.03.017 · PMID: 20399149 · PMCID: PMC2872684
19. DNA Methylation, Isocitrate Dehydrogenase Mutation, and Survival in Glioma
Brock C. Christensen, Ashley A. Smith, Shichun Zheng, Devin C. Koestler, E. Andres Houseman, Carmen J. Marsit, Joseph L. Wiemels, Heather H. Nelson, Margaret R. Karagas, Margaret R. Wrensch, … John K. Wiencke JNCI: Journal of the National Cancer Institute (2011-01-19) https://doi.org/bbjqf9
DOI: 10.1093/jnci/djq497 · PMID: 21163902 · PMCID: PMC3022619
20. IDH1 and IDH2 Mutations in Gliomas
Hai Yan, D. Williams Parsons, Genglin Jin, Roger McLendon, B. Ahmed Rasheed, Weishi Yuan, Ivan Kos, Ines Batinic-Haberle, Siân Jones, Gregory J. Riggins, … Darell D. Bigner New England Journal of Medicine (2009-02-19) https://doi.org/btz6db
DOI: 10.1056/nejmoa0808710 · PMID: 19228619 · PMCID: PMC2820383
21. IDH mutation impairs histone demethylation and results in a block to cell differentiation
Chao Lu, Patrick S. Ward, Gurpreet S. Kapoor, Dan Rohle, Sevin Turcan, Omar Abdel-Wahab, Christopher R. Edwards, Raya Khanin, Maria E. Figueroa, Ari Melnick, … Craig B. Thompson Nature (2012-02-15) https://doi.org/f4msnt
DOI: 10.1038/nature10860 · PMID: 22343901 · PMCID: PMC3478770
23. SETting the Stage for Cancer Development: SETD2 and the Consequences of Lost Methylation
Catherine C. Fahey, Ian J. Davis Cold Spring Harbor Perspectives in Medicine (2017-05) https://doi.org/gjmfvq
DOI: 10.1101/cshperspect.a026468 · PMID: 28159833 · PMCID: PMC5411680
24. Mechanisms underlying mutational signatures in human cancers
Thomas Helleday, Saeed Eshtad, Serena Nik-Zainal Nature Reviews Genetics (2014-07-01) https://doi.org/f25gnp
DOI: 10.1038/nrg3729 · PMID: 24981601 · PMCID: PMC6044419
25. Quantitative Proteomics of the Cancer Cell Line Encyclopedia
David P. Nusinow, John Szpyt, Mahmoud Ghandi, Christopher M. Rose, E. Robert McDonald, Marian Kalocsay, Judit Jané-Valbuena, Ellen Gelfand, Devin K. Schweppe, Mark Jedrychowski, … Steven P. Gygi Cell (2020-01) https://doi.org/ggxbh5
DOI: 10.1016/j.cell.2019.12.023 · PMID: 31978347 · PMCID: PMC7339254
26. The repertoire of mutational signatures in human cancer
Ludmil B. Alexandrov, Jaegil Kim, Nicholas J. Haradhvala, Mi Ni Huang, Alvin Wei Tian Ng, Yang Wu, Arnoud Boot, Kyle R. Covington, Dmitry A. Gordenin, Erik N. Bergstrom, … PCAWG Consortium Nature (2020-02-05) https://doi.org/ggkfnv
DOI: 10.1038/s41586-020-1943-3 · PMID: 32025018 · PMCID: PMC7054213
27. Significant associations between driver gene mutations and DNA methylation alterations across many cancer types
Yun-Ching Chen, Valer Gotea, Gennady Margolin, Laura Elnitski PLOS Computational Biology (2017-11-10) https://doi.org/gchz8h
DOI: 10.1371/journal.pcbi.1005840 · PMID: 29125844 · PMCID: PMC5709060
28. A pan-cancer analysis of driver gene mutations, DNA methylation and gene expressions reveals that chromatin remodeling is a major mechanism inducing global changes in cancer epigenomes
Ahrim Youn, Kyung In Kim, Raul Rabadan, Benjamin Tycko, Yufeng Shen, Shuang Wang BMC Medical Genomics (2018-11-06) https://doi.org/gjmhfb
DOI: 10.1186/s12920-018-0425-z · PMID: 30400878 · PMCID: PMC6218985
29. Computational analysis reveals histotype-dependent molecular profile and actionable mutation effects across cancers
Daniel Heim, Grégoire Montavon, Peter Hufnagl, Klaus-Robert Müller, Frederick Klauschen Genome Medicine (2018-11-15) https://doi.org/gjmhfc
DOI: 10.1186/s13073-018-0591-9 · PMID: 30442178 · PMCID: PMC6238410
32. Inference of patient-specific pathway activities from multi-dimensional cancer genomics data using PARADIGM
Charles J. Vaske, Stephen C. Benz, J. Zachary Sanborn, Dent Earl, Christopher Szeto, Jingchun Zhu, David Haussler, Joshua M. Stuart Bioinformatics (2010-06-15) https://doi.org/bcvgjf
DOI: 10.1093/bioinformatics/btq182 · PMID: 20529912 · PMCID: PMC2881367
33. Systematic analysis of somatic mutations impacting gene expression in 12 tumour types
Jiarui Ding, Melissa K. McConechy, Hugo M. Horlings, Gavin Ha, Fong Chun Chan, Tyler Funnell, Sarah C. Mullaly, Jüri Reimand, Ali Bashashati, Gary D. Bader, … Sohrab P. Shah Nature Communications (2015-10-05) https://doi.org/f7z86p
DOI: 10.1038/ncomms9554 · PMID: 26436532 · PMCID: PMC4600750
35. Scalable Open Science Approach for Mutation Calling of Tumor Exomes Using Multiple Genomic Pipelines
Kyle Ellrott, Matthew H. Bailey, Gordon Saksena, Kyle R. Covington, Cyriac Kandoth, Chip Stewart, Julian Hess, Singer Ma, Kami E. Chiotti, Michael McLellan, … Armaz Mariamidze Cell Systems (2018-03) https://doi.org/gf9twn
DOI: 10.1016/j.cels.2018.03.002 · PMID: 29596782 · PMCID: PMC6075717
36. GISTIC2.0 facilitates sensitive and confident localization of the targets of focal somatic copy-number alteration in human cancers
Craig H Mermel, Steven E Schumacher, Barbara Hill, Matthew L Meyerson, Rameen Beroukhim, Gad Getz Genome Biology (2011-04-28) https://doi.org/dzhjqh
DOI: 10.1186/gb-2011-12-4-r41 · PMID: 21527027 · PMCID: PMC3218867
37. Scikit-learn: Machine Learning in Python
Fabian Pedregosa, Gaël Varoquaux, Alexandre Gramfort, Vincent Michel, Bertrand Thirion, Olivier Grisel, Mathieu Blondel, Peter Prettenhofer, Ron Weiss, Vincent Dubourg, … Édouard Duchesnay Journal of Machine Learning Research (2011) http://jmlr.org/papers/v12/pedregosa11a.html
38. A beta-mixture quantile normalization method for correcting probe design bias in Illumina Infinium 450 k DNA methylation data
Andrew E. Teschendorff, Francesco Marabita, Matthias Lechner, Thomas Bartlett, Jesper Tegner, David Gomez-Cabrero, Stephan Beck Bioinformatics (2013-01-15) https://doi.org/f25mvt
DOI: 10.1093/bioinformatics/bts680 · PMID: 23175756 · PMCID: PMC3546795
39. Regularization and variable selection via the elastic net
Hui Zou, Trevor Hastie Journal of the Royal Statistical Society: Series B (Statistical Methodology) (2005-04) https://doi.org/b8cwwr
DOI: 10.1111/j.1467-9868.2005.00503.x
41. A critical investigation of recall and precision as measures of retrieval system performance
Vijay Raghavan, Peter Bollmann, Gwang S. Jung ACM Transactions on Information Systems (1989-07) https://doi.org/bg4tps
DOI: 10.1145/65943.65945
43. The MCC-F1 curve: a performance evaluation technique for binary classification
Chang Cao, Davide Chicco, Michael M. Hoffman arXiv (2020-06-23) https://arxiv.org/abs/2006.11278
44. Genome-wide identification and analysis of prognostic features in human cancers
Joan C. Smith, Jason M. Sheltzer Cold Spring Harbor Laboratory (2021-06-01) https://doi.org/gmqfqt
DOI: 10.1101/2021.06.01.446243
45. scikit-survival: A Library for Time-to-Event Analysis Built on Top of scikit-learn
Sebastian Pölsterl Journal of Machine Learning Research (2020) http://jmlr.org/papers/v21/20-729.html
47. Open collaborative writing with Manubot
Daniel S. Himmelstein, Vincent Rubinetti, David R. Slochower, Dongbo Hu, Venkat S. Malladi, Casey S. Greene, Anthony Gitter PLOS Computational Biology (2019-06-24) https://doi.org/c7np
DOI: 10.1371/journal.pcbi.1007128 · PMID: 31233491 · PMCID: PMC6611653
48. Integrated genomic characterization of IDH1-mutant glioma malignant progression
Hanwen Bai, Akdes Serin Harmancı, E Zeynep Erson-Omay, Jie Li, Süleyman Coşkun, Matthias Simon, Boris Krischek, Koray Özduman, S Bülent Omay, Eric A Sorensen, … Murat Günel Nature Genetics (2015-11-30) https://doi.org/f895hx
DOI: 10.1038/ng.3457 · PMID: 26618343 · PMCID: PMC4829945
49. Identification and validation of an ERBB2 gene expression signature in breast cancers
François Bertucci, Nathalie Borie, Christophe Ginestier, Agnès Groulet, Emmanuelle Charafe-Jauffret, José Adélaïde, Jeannine Geneix, Loïc Bachelart, Pascal Finetti, Alane Koki, … Daniel Birnbaum Oncogene (2004-01-26) https://doi.org/dq9kvk
DOI: 10.1038/sj.onc.1207361 · PMID: 14743203
50. Pan-Cancer Landscape and Analysis of ERBB2 Mutations Identifies Poziotinib as a Clinically Active Inhibitor and Enhancer of T-DM1 Activity
Jacqulyne P. Robichaux, Yasir Y. Elamin, R. S. K. Vijayan, Monique B. Nilsson, Lemei Hu, Junqin He, Fahao Zhang, Marlese Pisegna, Alissa Poteete, Huiying Sun, … John V. Heymach Cancer Cell (2019-10) https://doi.org/ggcv27
DOI: 10.1016/j.ccell.2019.09.001 · PMID: 31588020 · PMCID: PMC6944069
52. TCPA: a resource for cancer functional proteomics data
Jun Li, Yiling Lu, Rehan Akbani, Zhenlin Ju, Paul L Roebuck, Wenbin Liu, Ji-Yeon Yang, Bradley M Broom, Roeland GW Verhaak, David W Kane, … Han Liang Nature Methods (2013-09-15) https://doi.org/gffkjm
DOI: 10.1038/nmeth.2650 · PMID: 24037243 · PMCID: PMC4076789
53. Patterns of somatic structural variation in human cancer genomes
Yilong Li, Nicola D. Roberts, Jeremiah A. Wala, Ofer Shapira, Steven E. Schumacher, Kiran Kumar, Ekta Khurana, Sebastian Waszak, Jan O. Korbel, James E. Haber, … PCAWG Consortium Nature (2020-02-05) https://doi.org/ggkfnw
DOI: 10.1038/s41586-019-1913-9 · PMID: 32025012 · PMCID: PMC7025897
54. MethylNet: an automated and modular deep learning approach for DNA methylation analysis
Joshua J. Levy, Alexander J. Titus, Curtis L. Petersen, Youdinghuan Chen, Lucas A. Salas, Brock C. Christensen BMC Bioinformatics (2020-03-17) https://doi.org/ggxvrz
DOI: 10.1186/s12859-020-3443-8 · PMID: 32183722 · PMCID: PMC7076991
55. MethylSPWNet and MethylCapsNet: Biologically Motivated Organization of DNAm Neural Networks, Inspired by Capsule Networks.
Joshua J Levy, Youdinghuan Chen, Nasim Azizgolshani, Curtis L Petersen, Alexander J Titus, Erika L Moen, Louis J Vaickus, Lucas A Salas, Brock C Christensen NPJ systems biology and applications (2021-08-20) https://www.ncbi.nlm.nih.gov/pubmed/34417465
DOI: 10.1038/s41540-021-00193-7 · PMID: 34417465 · PMCID: PMC8379254
56. Predicting Drug Response and Synergy Using a Deep Learning Model of Human Cancer Cells
Brent M. Kuenzi, Jisoo Park, Samson H. Fong, Kyle S. Sanchez, John Lee, Jason F. Kreisberg, Jianzhu Ma, Trey Ideker Cancer Cell (2020-11) https://doi.org/gh7z2n
DOI: 10.1016/j.ccell.2020.09.014 · PMID: 33096023 · PMCID: PMC7737474
57. Biological Constraints Can Improve Prediction in Precision Oncology
Mohamed Omar, Lotte Mulder, Tendai Coady, Claudio Zanettini, Eddie Luidy Imada, Wikum Dinalankara, Laurent Younes, Donald Geman, Luigi Marchionni Cold Spring Harbor Laboratory (2021-05-27) https://doi.org/gkcc43
DOI: 10.1101/2021.05.25.445604
58. Principles and methods of integrative genomic analyses in cancer
Vessela N. Kristensen, Ole Christian Lingjærde, Hege G. Russnes, Hans Kristian M. Vollan, Arnoldo Frigessi, Anne-Lise Børresen-Dale Nature Reviews Cancer (2014-04-24) https://doi.org/gf66jv
DOI: 10.1038/nrc3721 · PMID: 24759209
59. Predicting censored survival data based on the interactions between meta-dimensional omics data in breast cancer
Dokyoon Kim, Ruowang Li, Scott M. Dudek, Marylyn D. Ritchie Journal of Biomedical Informatics (2015-08) https://doi.org/f7n49h
DOI: 10.1016/j.jbi.2015.05.019 · PMID: 26048077 · PMCID: PMC4550096
60. Combining DNA methylation and RNA sequencing data of cancer for supervised knowledge extraction
Eleonora Cappelli, Giovanni Felici, Emanuel Weitschek BioData Mining (2018-10-25) https://doi.org/gkcdbm
DOI: 10.1186/s13040-018-0184-6 · PMID: 30386434 · PMCID: PMC6203208
61. MOLI: multi-omics late integration with deep neural networks for drug response prediction
Hossein Sharifi-Noghabi, Olga Zolotareva, Colin C Collins, Martin Ester Bioinformatics (2019-07) https://doi.org/fxbz
DOI: 10.1093/bioinformatics/btz318 · PMID: 31510700 · PMCID: PMC6612815
62. Accurate cancer phenotype prediction with AKLIMATE, a stacked kernel learner integrating multimodal genomic data and pathway knowledge
Vladislav Uzunangelov, Christopher K. Wong, Joshua M. Stuart PLOS Computational Biology (2021-04-16) https://doi.org/gkcdbn
DOI: 10.1371/journal.pcbi.1008878 · PMID: 33861732 · PMCID: PMC8081343
63. Methods for biological data integration: perspectives and challenges
Vladimir Gligorijević, Nataša Pržulj Journal of The Royal Society Interface (2015-11-06) https://doi.org/bdzp
DOI: 10.1098/rsif.2015.0571 · PMID: 26490630 · PMCID: PMC4685837
64. Machine learning for integrating data in biology and medicine: Principles, practice, and opportunities
Marinka Zitnik, Francis Nguyen, Bo Wang, Jure Leskovec, Anna Goldenberg, Michael M. Hoffman Information Fusion (2019-10) https://doi.org/gf7rj8
DOI: 10.1016/j.inffus.2018.09.012 · PMID: 30467459 · PMCID: PMC6242341
65. Integrated phosphoproteomics and transcriptional classifiers reveal hidden RAS signaling dynamics in multiple myeloma
Yu-Hsiu T. Lin, Gregory P. Way, Benjamin G. Barwick, Margarette C. Mariano, Makeba Marcoulis, Ian D. Ferguson, Christoph Driessen, Lawrence H. Boise, Casey S. Greene, Arun P. Wiita Blood Advances (2019-11-12) https://doi.org/gg7m56
DOI: 10.1182/bloodadvances.2019000303 · PMID: 31698452 · PMCID: PMC6855123
66. Next-generation characterization of the Cancer Cell Line Encyclopedia
Mahmoud Ghandi, Franklin W. Huang, Judit Jané-Valbuena, Gregory V. Kryukov, Christopher C. Lo, E. Robert McDonald, Jordi Barretina, Ellen T. Gelfand, Craig M. Bielski, Haoxin Li, … William R. Sellers Nature (2019-05-08) https://doi.org/gf2m3h
DOI: 10.1038/s41586-019-1186-3 · PMID: 31068700 · PMCID: PMC6697103
67. Comprehensive transcriptomic analysis of cell lines as models of primary tumors across 22 tumor types
K. Yu, B. Chen, D. Aran, J. Charalel, C. Yau, D. M. Wolf, L. J. van ‘t Veer, A. J. Butte, T. Goldstein, M. Sirota Nature Communications (2019-08-08) https://doi.org/ggh7t7
DOI: 10.1038/s41467-019-11415-2 · PMID: 31395879 · PMCID: PMC6687785
68. Clonal status of actionable driver events and the timing of mutational processes in cancer evolution
Nicholas McGranahan, Francesco Favero, Elza C. de Bruin, Nicolai Juul Birkbak, Zoltan Szallasi, Charles Swanton Science Translational Medicine (2015-04-15) https://doi.org/f7f83d
DOI: 10.1126/scitranslmed.aaa1408 · PMID: 25877892 · PMCID: PMC4636056
 0000-0001-6207-0782
·
0000-0001-6207-0782
·  jjc2718
·
jjc2718
·  jjc2718