David N. Nicholson 0000-0003-0002-5761 · danich1 Department of Systems Pharmacology and Translational Therapeutics, University of Pennsylvania · Funded by GBMF4552
Daniel S. Himmelstein 0000-0002-3012-7446 · dhimmel · dhimmel Department of Systems Pharmacology and Translational Therapeutics, University of Pennsylvania · Funded by GBMF4552
Casey S. Greene 0000-0001-8713-9213 · cgreene · GreeneScientist Department of Systems Pharmacology and Translational Therapeutics, University of Pennsylvania · Funded by GBMF4552 and R01 HG010067
Abstract
Knowledge bases support multiple research efforts such as providing contextual information for biomedical entities, constructing networks, and supporting the interpretation of high-throughput analyses. Some knowledge bases are automatically constructed, but most are populated via some form of manual curation. Manual curation is time consuming and difficult to scale in the context of an increasing publication rate. A recently described “data programming” paradigm seeks to circumvent this arduous process by combining distant supervision with simple rules and heuristics written as labeling functions that can be automatically applied to inputs. Unfortunately writing useful label functions requires substantial error analysis and is a nontrivial task: in early efforts to use data programming we found that producing each label function could take a few days. Producing a biomedical knowledge base with multiple node and edge types could take hundreds or possibly thousands of label functions. In this paper we sought to evaluate the extent to which label functions could be re-used across edge types. We used a subset of Hetionet v1 that centered on disease, compound, and gene nodes to evaluate this approach. We compared a baseline distant supervision model with the same distant supervision resources added to edge-type-specific label functions, edge-type-mismatch label functions, and all label functions. We confirmed that adding additional edge-type-specific label functions improves performance. We also found that adding one or a few edge-type-mismatch label functions nearly always improved performance. Adding a large number of edge-type-mismatch label functions produce variable performance that depends on the edge type being predicted and the label function’s edge type source. Lastly, we show that this approach, even on this subgraph of Hetionet, could add new edges to Hetionet v1 with high confidence. We expect that practical use of this strategy would include additional filtering and scoring methods which would further enhance precision.
Introduction
Knowledge bases are important resources that hold complex structured and unstructed information. These resources have been used in important tasks such as network analysis for drug repurposing discovery [1,2,3] or as a source of training labels for text mining systems [4,5,6]. Populating knowledge bases often requires highly-trained scientists to read biomedical literature and summarize the results [7]. This manual curation process requires a significant amount of effort and time: in 2007 researchers estimated that filling in the missing annotations would require approximately 8.4 years [8]. The rate of publications has continued to increase exponentially [9]. This has been recognized as a considerable challenge, which can lead to gaps in knowledge bases [8].
Relationship extraction has been studied as a solution towards handling this problem [7]. This process consists of creating a machine learning system to automatically scan and extract relationships from textual sources. Machine learning methods often leverage a large corpus of well-labeled training data, which still requires manual curation. Distant supervision is one technique to sidestep the requirement of well-annotated sentences: with distant supervision one makes the assumption that all sentences containing an entity pair found in a selected database provide evidence for a relationship [4]. Distant supervision provides many labeled examples; however it is accompanied by a decrease in the quality of the labels.
Ratner et al. [10] recently introduced “data programming” as a solution. Data programming combines distant supervision with the automated labeling of text using hand-written label functions. The distant supervision sources and label functions are integrated using a noise aware generative model that is used to produce training labels. Combining distant supervision with label functions can dramatically reduce the time required to acquire sufficient training data. However, constructing a knowledge base of heterogeneous relationships through this framework still requires tens of hand-written label functions for each relationship type. Writing useful label functions requires significant error analysis, which can be a time-consuming process.
In this paper, we aim to address the question: to what extent can label functions be re-used across different relationship types? We hypothesized that sentences describing one relationship type may share information in the form of keywords or sentence structure with sentences that indicate other relationship types. We designed a series of experiments to determine the extent to which label function re-use enhanced performance over distant supervision alone. We examined relationships that indicated similar types of physical interactions (i.e., gene-binds-gene and compound-binds-gene) as well as different types (i.e., disease-associates-gene and compound-treats-disease). The re-use of label functions could dramatically reduce the number required to generate and update a heterogeneous knowledge graph.
Related Work
Relationship extraction is the process of detecting and classifying semantic relationships from a collection of text. This process can be broken down into three different categories: (1) the use of natural language processing techniques such as manually crafted rules and the identification of key text patterns for relationship extraction, (2) the use of unsupervised methods via co-occurrence scores or clustering, and (3) supervised or semi-supervised machine learning using annotated datasets for the classification of documents or sentences. In this section, we discuss selected efforts for each type of edge that we include in this project.
Disease-Gene Associations
Efforts to extract Disease-associates-Gene (DaG) relationships have often used manually crafted rules or unsupervised methods. One study used hand crafted rules based on a sentence’s grammatical structure, represented as dependency trees, to extract DaG relationships [11]. Some of these rules inspired certain DaG text pattern label functions in our work. Another study used co-occurrence frequencies within abstracts and sentences to score the likelihood of association between disease and gene pairs [12]. The results of this study were incorporated into Hetionet v1 [3], so this served as one of our distant supervision label functions. Another approach built off of the above work by incorporating a supervised classifier, trained via distant supervision, into a scoring scheme [13]. Each sentence containing a disease and gene mention is scored using a logistic regression model and combined using the same co-occurrence approach used in Pletscher-Frankild et al. [12]. We compared our results to this approach to measure how well our overall method performs relative to other methods. Besides the mentioned three studies, researchers have used co-occurrences for extraction alone [14,15,16] or in combination with other features to recover DaG relationships [17]. One recent effort relied on a bi-clustering approach to detect DaG-relevant sentences from Pubmed abstracts [18] with clustering of dependency paths grouping similar sentences together. The results of this work supply our domain heuristic label functions. These approaches do not rely on a well-annotated training performance and tend to provide excellent recall, though the precision is often worse than with supervised methods [19,20].
Hand-crafted high-quality datasets [21,22,23,24] often serve as a gold standard for training, tuning, and testing supervised machine learning methods in this setting. Support vector machines have been repeatedly used to detect DaG relationships [21,25,26]. These models perform well in large feature spaces, but are slow to train as the number of data points becomes large. Recently, some studies have used deep neural network models. One used a pre-trained recurrent neural network [27], and another used distant supervision [28]. Due to the success of these two models, we decided to use a deep neural network as our discriminative model.
Compound Treats Disease
The goal of extracting Compound-treats-Disease (CtD) edges is to identify sentences that mention current drug treatments or propose new uses for existing drugs. One study combined an inference model from previously established drug-gene and gene-disease relationships to infer novel drug-disease interactions via co-occurrences [29]. A similar approach has also been applied to CtD extraction [30]. Manually-curated rules have also been applied to PubMed abstracts to address this task [31]. The rules were based on identifying key phrases and wordings related to using drugs to treat a disease, and we used these patterns as inspirations for some of our CtD label functions. Lastly, one study used a bi-clustering approach to identify sentences relevant to CtD edges [18]. As with DaG edges, we use the results from this study to provide what we term as domain heuristic label functions.
Recent work with supervised machine learning methods has often focused on compounds that induce a disease: an important question for toxicology and the subject of the BioCreative V dataset [32]. We don’t consider environmental toxicants in our work, as our source databases for distant supervision are primarily centered around FDA-approved therapies.
Compound Binds Gene
The BioCreative VI track 5 task focused on classifying compound-protein interactions and has led to a great deal of work on the topic [33]. The equivalent edge in our networks is Compound-binds-Gene (CbG). Curators manually annotated 2,432 PubMed abstracts for five different compound protein interactions (agonist, antagonist, inhibitor, activator and substrate/product production) as part of the BioCreative task. The best performers on this task achieved an F1 score of 64.10% [33]. Numerous additional groups have now used the publicly available dataset, that resulted from this competition, to train supervised machine learning methods [27,34,35,36,36,37,38,39,40] and semi-supervised machine learning methods [41]. These approaches depend on well-annotated training datasets, which creates a bottleneck. In addition to supervised and semi-supervised machine learning methods, hand crafted rules [42] and bi-clustering of dependency trees [18] have been used. We use the results from the bi-clustering study to provide a subset of the CbG label functions in this work.
Gene-Gene Interactions
Akin to the DaG edge type, many efforts to extract Gene-interacts-Gene (GiG) relationships used co-occurrence approaches. This edge type is more frequently referred to as a protein-protein interaction. Even approaches as simple as calculating Z-scores from PubMed abstract co-occurrences can be informative [43], and there are numerous studies using co-occurrences [16,44,45,46]. However, more sophisticated strategies such as distant supervision appear to improve performance [13]. Similarly to the other edge types, the bi-clustering approach over dependency trees has also been applied to this edge type [18]. This manuscript provides a set of label functions for our work.
Most supervised classifiers used publicly available datasets for evaluation [47,48,49,50,51]. These datasets are used equally among studies, but can generate noticeable differences in terms of performance [52]. Support vector machines were a common approach to extract GiG edges [53,54]. However, with the growing popularity of deep learning numerous deep neural network architectures have been applied [41,55,56,57]. Distant supervision has also been used in this domain [58], and in fact this effort was one of the motivating rationales for our work.
Materials and Methods
Hetionet
Figure 1: A metagraph (schema) of Hetionet where biomedical entities are represented as nodes and the relationships between them are represented as edges. We examined performance on the highlighted subgraph; however, the long-term vision is to capture edges for the entire graph.
Hetionet [3] is a large heterogenous network that contains pharmacological and biological information. This network depicts information in the form of nodes and edges of different types: nodes that represent biological and pharmacological entities and edges which represent relationships between entities. Hetionet v1.0 contains 47,031 nodes with 11 different data types and 2,250,197 edges that represent 24 different relationship types (Figure 1). Edges in Hetionet were obtained from open databases, such as the GWAS Catalog [59] and DrugBank [60]. For this project, we analyzed performance over a subset of the Hetionet relationship types: disease associates with a gene (DaG), compound binds to a gene (CbG), gene interacts with gene (GiG) and compound treating a disease (CtD).
Dataset
We used PubTator [61] as input to our analysis. PubTator provides MEDLINE abstracts that have been annotated with well-established entity recognition tools including DNorm [62] for disease mentions, GeneTUKit [63] for gene mentions, Gnorm [64] for gene normalizations and a dictionary based search system for compound mentions [65]. We downloaded PubTator on June 30, 2017, at which point it contained 10,775,748 abstracts. Then we filtered out mention tags that were not contained in hetionet. We used the Stanford CoreNLP parser [66] to tag parts of speech and generate dependency trees. We extracted sentences with two or more mentions, termed candidate sentences. Each candidate sentence was stratified by co-mention pair to produce a training set, tuning set and a testing set (shown in Table 1). Each unique co-mention pair is sorted into four categories: (1) in hetionet and has sentences, (2) in hetionet and doesn’t have sentences, (3) not in hetionet and does have sentences and (4) not in hetionet and doesn’t have sentences. Within these four categories each pair is randomly assigned their own individual partition rank (continuous number between 0 and 1). Any rank lower than 0.7 is sorted into the training set, while any rank greater than 0.7 and lower than 0.9 is assigned to the tuning set. The rest of the pairs with a rank greater than or equal to 0.9 is assigned to the test set. Sentences that contain more than one co-mention pair are treated as multiple individual candidates. We hand labeled five hundred to a thousand candidate sentences of each relationship type to obtain a ground truth set (Table 1)1.
Table 1: Statistics of Candidate Sentences. We sorted each candidate sentence into a training, tuning and testing set. Numbers in parentheses show the number of positives and negatives that resulted from the hand-labeling process.
Relationship
Train
Tune
Test
Disease Associates Gene
2.35 M
31K (397+, 603-)
313K (351+, 649-)
Compound Binds Gene
1.7M
468K (37+, 463-)
227k (31+, 469-)
Compound Treats Disease
1.013M
96K (96+, 404-)
32K (112+, 388-)
Gene Interacts Gene
12.6M
1.056M (60+, 440-)
257K (76+, 424-)
Label Functions for Annotating Sentences
The challenge of having too few ground truth annotations is common to many natural language processing settings, even when unannotated text is abundant. Data programming circumvents this issue by quickly annotating large datasets by using multiple noisy signals emitted by label functions [10]. Label functions are simple pythonic functions that emit: a positive label (1), a negative label (-1) or abstain from emitting a label (0). We combine these functions using a generative model to output a single annotation, which is a consensus probability score bounded between 0 (low chance of mentioning a relationship) and 1 (high chance of mentioning a relationship). We used these annotations to train a discriminator model that makes the final classification step. Our label functions fall into three categories: databases, text patterns and domain heuristics. We provide examples for each category in our supplemental methods section.
Training Models
Generative Model
The generative model is a core part of this automatic annotation framework. It integrates multiple signals emitted by label functions and assigns a training class to each candidate sentence. This model assigns training classes by estimating the joint probability distribution of the latent true class (\(Y\)) and label function signals (\(\Lambda\)), \(P(\Lambda, Y)\). Assuming each label function is conditionally independent, the joint distribution is defined as follows:
where \(m\) is the number of candidate sentences, \(F\) is the vector of summary statistics and \(\theta\) is a vector of weights for each summary statistic. The summary statistics used by the generative model are as follows:
Lab is the label function’s propensity (the frequency of a label function emitting a signal). Acc is the individual label function’s accuracy given the training class. This model optimizes the weights (\(\theta\)) by minimizing the negative log likelihood:
In the framework we used predictions from the generative model, \(\hat{Y} = P(Y \mid \Lambda)\), as training classes for our dataset [67,68].
Experimental Design
Being able to re-use label functions across edge types would substantially reduce the number of label functions required to extract multiple relationships from biomedical literature. We first established a baseline by training a generative model using only distant supervision label functions designed for the target edge type. As an example, for the GiG edge type we used label functions that returned a 1 if the pair of genes were included in the Human Interaction database [69], the iRefIndex database [70] or in the Incomplete Interactome database [71]. Then we compared models that also included text and domain-heuristic label functions. Using a sampling with replacement approach, we sampled these text and domain-heuristic label functions separately within edge types, across edge types, and from a pool of all label functions. We compared within-edge-type performance to across-edge-type and all-edge-type performance. For each edge type we sampled a fixed number of label functions consisting of five evenly-spaced numbers between one and the total number of possible label functions. We repeated this sampling process 50 times for each point. We evaluated both generative and discriminative (training and downstream analyses are described in the supplemental methods section) models at each point, and we reported performance of each in terms of the area under the receiver operating characteristic curve (AUROC) and the area under the precision-recall curve (AUPR). Lastly, we conducted a follow up experiment for the generative model described in the supplemental methods section.
Results
Generative Model Using Randomly Sampled Label Functions
Figure 2: Grid of AUROC scores for each generative model trained on randomly sampled label functions. The rows depict the relationship each model is trying to predict and the columns are the edge type specific sources from which each label function is sampled. The right most column consists of pooling every relationship specific label function and proceeding as above.
We added randomly sampled label functions to a baseline for each edge type to evaluate the feasibility of label function re-use. Our baseline model consisted of a generative model trained with only edge-specific distant supervision label functions. We reported the results in AUROC and AUPR (Figure 2 and Supplemental Figure 5).
The on-diagonal plots of figure 2 and supplemental figure 5 show increasing performance when edge-specific label functions are added on top of the edge-specific baselines. The CtD edge type is a quintessential example of this trend. The baseline model starts off with an AUROC score of 52% and an AUPRC of 28%, which increase to 76% and 49% respectively as more CtD label functions are included. DaG edges have a similar trend: performance starting off with an AUROC of 56% and AUPR of 41% then increases to 62% and 45% respectively. Both the CbG and GiG edges have an increasing trend but plateau after a few label functions are added.
The off-diagonals in figure 2 and supplemental figure 5 show how performance varies when label functions from one edge type are added to a different edge type’s baseline. In certain cases (apparent for DaG), performance increases regardless of the edge type used for label functions. In other cases (apparent with CtD), one label function appears to improve performance; however, adding more label functions does not improve performance (AUROC) or decreases it (AUPR). In certain cases, the source of the label functions appears to be important: the performance of CbG edges decrease when using label functions from the DaG and CtD categories.
Our initial hypothesis was based on the idea that certain edge types capture similar physical relationships and that these cases would be particularly amenable for label function transfer. For example, CbG and GiG both describe physical interactions. We observed that performance increased as assessed by both AUROC and AUPR when using label functions from the GiG edge type to predict CbG edges. A similar trend was observed when predicting the GiG edge; however, the performance differences were small for this edge type making the importance difficult to assess.
The last column shows increasing performance (AUROC and AUPR) for both DaG and CtD when sampling from all label functions. CbG and GiG also had increased performance when one random label function was sampled, but performance decreased drastically as more label functions were added. It is possible that a small number of irrelevant label functions are able to overwhelm the distant supervision label functions in these cases (see Figure 3 and Supplemental Figure 6).
Random Label Function Generative Model Analysis
Figure 3: A grid of AUROC (A) scores for each edge type. Each plot consists of adding a single label function on top of the baseline model. This label function emits a positive (shown in blue) or negative (shown in orange) label at specified frequencies, and performance at zero is equivalent to not having a randomly emitting label function. The error bars represent 95% confidence intervals for AUROC or AUPR (y-axis) at each emission frequency.
We observed that including one label function of a mismatched type to distant supervision often improved performance, so we evaluated the effects of adding a random label function in the same setting. We found that usually adding random noise did not improve performance (Figure 3 and Supplemental Figure 6). For the CbG edge type we did observe slightly increased performance via AUPR (Supplemental Figure 6). However, performance changes in general were smaller than those observed with mismatched label types.
Discussion
We tested the feasibility of re-using label functions to extract relationships from literature. Through our sampling experiment, we found that adding relevant label functions increases prediction performance (shown in the on-diagonals of Figures 2 and Supplemental Figure 5). We found that label functions designed from relatively related edge types can increase performance (seen when GiG label functions predicts CbG and vice versa). We noticed that one edge type (DaG) is agnostic to label function source (Figure 2 and Supplemental Figure 5). Performance routinely increases when adding a single mismatched label function to our baseline model (the generative model trained only on distant supervision label functions). These results led us to hypothesize that adding a small amount of noise aided the model, but our experiment with a random label function reveals that this was not the case (Figures 3 and 6). Based on these results one question still remains: why does performance drastically increase when adding a single label function to our distant supervision baseline?
The discriminative model didn’t work as intended. The majority of the time the discriminative model underperformed the generative model (Supplemental Figures 7 and 8). Potential reasons for this are the discriminative model overfitting to the generative model’s predictions and a negative class bias in some of our datasets (Table 1). The challenges with the discriminative model are likely to have led to issues in our downstream analyses: poor model calibration (Supplemental Figure 9) and poor recall in detecting existing Hetionet edges (Supplemental Figure 11). Despite the above complications, our model had similar performance with a published baseline model (Supplemental Figure 10). This implies that with better tuning the discriminative model has the potential to perform better than the baseline model.
Conclusion and Future Direction
Filling out knowledge bases via manual curation can be an arduous and erroneous task [8]. As the rate of publications increases manual curation becomes an infeasible approach. Data programming, a paradigm that uses label functions as a means to speed up the annotation process, can be used as a solution for this problem. A problem with this paradigm is that creating a useful label function takes a significant amount of time. We tested the feasibility of reusing label functions as a way to speed up the label function creation process. We conclude that label function re-use across edge types can increase performance when there are certain constraints on the number of functions re-used. More sophisticated methods of reuse may be able to capture many of the advantages and avoid many of the drawbacks. Adding more relevant label functions can increase overall performance. The discriminative model, under this paradigm, has a tendency to overfit to predictions of the generative model. We recommend implementing regularization techniques such as drop out and weight decay to combat this issue.
This work sets up the foundation for creating a common framework that mines text to create edges. Within this framework we would continuously ingest new knowledge as novel findings are published, while providing a single confidence score for an edge by consolidating sentence scores. Different from existing hetnets like Hetionet where text-derived edges generally cannot be exactly attributed to excerpts from literature [3,72], our approach would annotate each edge with its source sentences. In addition, edges generated with this approach would be unencumbered from upstream licensing or copyright restrictions, enabling openly licensed hetnets at a scale not previously possible [73,74,75]. Accordingly, we plan to use this framework to create a robust multi-edge extractor via multitask learning [68] to construct continuously updating literature-derived hetnets.
The authors would like to thank Christopher Ré’s group at Stanford Univeristy, especially Alex Ratner and Steven Bach, for their assistance with this project. We also want to thank Graciela Gonzalez-Hernandez for her advice and input with this project. This work was support by Grant GBMF4552 from the Gordon Betty Moore Foundation.
References
1. Graph Theory Enables Drug Repurposing – How a Mathematical Model Can Drive the Discovery of Hidden Mechanisms of Action
Ruggero Gramatica, T. Di Matteo, Stefano Giorgetti, Massimo Barbiani, Dorian Bevec, Tomaso Aste PLoS ONE (2014-01-09) https://doi.org/gf45zp
DOI: 10.1371/journal.pone.0084912 · PMID: 24416311 · PMCID: PMC3886994
2. Drug repurposing through joint learning on knowledge graphs and literature
Mona Alshahrani, Robert Hoehndorf Cold Spring Harbor Laboratory (2018-08-06) https://doi.org/gf45zk
DOI: 10.1101/385617
3. Systematic integration of biomedical knowledge prioritizes drugs for repurposing
Daniel Scott Himmelstein, Antoine Lizee, Christine Hessler, Leo Brueggeman, Sabrina L Chen, Dexter Hadley, Ari Green, Pouya Khankhanian, Sergio E Baranzini eLife (2017-09-22) https://doi.org/cdfk
DOI: 10.7554/elife.26726 · PMID: 28936969 · PMCID: PMC5640425
4. Distant supervision for relation extraction without labeled data
Mike Mintz, Steven Bills, Rion Snow, Dan Jurafsky Proceedings of the Joint Conference of the 47th Annual Meeting of the ACL and the 4th International Joint Conference on Natural Language Processing of the AFNLP: Volume 2 - ACL-IJCNLP ’09 (2009) https://doi.org/fg9q43
DOI: 10.3115/1690219.1690287
5. CoCoScore: Context-aware co-occurrence scoring for text mining applications using distant supervision
Alexander Junge, Lars Juhl Jensen Cold Spring Harbor Laboratory (2018-10-16) https://doi.org/gf45zm
DOI: 10.1101/444398
7. Facts from text: can text mining help to scale-up high-quality manual curation of gene products with ontologies?
R. Winnenburg, T. Wachter, C. Plake, A. Doms, M. Schroeder Briefings in Bioinformatics (2008-07-11) https://doi.org/bfsnwg
DOI: 10.1093/bib/bbn043 · PMID: 19060303
8. Manual curation is not sufficient for annotation of genomic databases
William A. Baumgartner Jr, K. Bretonnel Cohen, Lynne M. Fox, George Acquaah-Mensah, Lawrence Hunter Bioinformatics (2007-07-01) https://doi.org/dtck86
DOI: 10.1093/bioinformatics/btm229 · PMID: 17646325 · PMCID: PMC2516305
9. Growth rates of modern science: A bibliometric analysis based on the number of publications and cited references
Lutz Bornmann, Rüdiger Mutz Journal of the Association for Information Science and Technology (2015-04-29) https://doi.org/gfj5zc
DOI: 10.1002/asi.23329
10. Data Programming: Creating Large Training Sets, Quickly
Alexander Ratner, Christopher De Sa, Sen Wu, Daniel Selsam, Christopher Ré arXiv (2016-05-25) https://arxiv.org/abs/1605.07723v3
12. DISEASES: Text mining and data integration of disease–gene associations
Sune Pletscher-Frankild, Albert Pallejà, Kalliopi Tsafou, Janos X. Binder, Lars Juhl Jensen Methods (2015-03) https://doi.org/f3mn6s
DOI: 10.1016/j.ymeth.2014.11.020 · PMID: 25484339
13. CoCoScore: context-aware co-occurrence scoring for text mining applications using distant supervision
Alexander Junge, Lars Juhl Jensen Bioinformatics (2019-06-14) https://doi.org/gf4789
DOI: 10.1093/bioinformatics/btz490 · PMID: 31199464
14. LGscore: A method to identify disease-related genes using biological literature and Google data
Jeongwoo Kim, Hyunjin Kim, Youngmi Yoon, Sanghyun Park Journal of Biomedical Informatics (2015-04) https://doi.org/f7bj9c
DOI: 10.1016/j.jbi.2015.01.003 · PMID: 25617670
15. PolySearch2: a significantly improved text-mining system for discovering associations between human diseases, genes, drugs, metabolites, toxins and more
Yifeng Liu, Yongjie Liang, David Wishart Nucleic Acids Research (2015-04-29) https://doi.org/f7nzn5
DOI: 10.1093/nar/gkv383 · PMID: 25925572 · PMCID: PMC4489268
16. A comprehensive and quantitative comparison of text-mining in 15 million full-text articles versus their corresponding abstracts
David Westergaard, Hans-Henrik Stærfeldt, Christian Tønsberg, Lars Juhl Jensen, Søren Brunak PLOS Computational Biology (2018-02-15) https://doi.org/gcx747
DOI: 10.1371/journal.pcbi.1005962 · PMID: 29447159 · PMCID: PMC5831415
19. Literature mining for the biologist: from information retrieval to biological discovery
Lars Juhl Jensen, Jasmin Saric, Peer Bork Nature Reviews Genetics (2006-02) https://doi.org/bgq7q9
DOI: 10.1038/nrg1768 · PMID: 16418747
21. Extraction of relations between genes and diseases from text and large-scale data analysis: implications for translational research
Àlex Bravo, Janet Piñero, Núria Queralt-Rosinach, Michael Rautschka, Laura I Furlong BMC Bioinformatics (2015-02-21) https://doi.org/f7kn8s
DOI: 10.1186/s12859-015-0472-9 · PMID: 25886734 · PMCID: PMC4466840
22. The EU-ADR corpus: Annotated drugs, diseases, targets, and their relationships
Erik M. van Mulligen, Annie Fourrier-Reglat, David Gurwitz, Mariam Molokhia, Ainhoa Nieto, Gianluca Trifiro, Jan A. Kors, Laura I. Furlong Journal of Biomedical Informatics (2012-10) https://doi.org/f36vn6
DOI: 10.1016/j.jbi.2012.04.004 · PMID: 22554700
23. CoMAGC: a corpus with multi-faceted annotations of gene-cancer relations
Hee-Jin Lee, Sang-Hyung Shim, Mi-Ryoung Song, Hyunju Lee, Jong C Park BMC Bioinformatics (2013) https://doi.org/gb8v5s
DOI: 10.1186/1471-2105-14-323 · PMID: 24225062 · PMCID: PMC3833657
24. Concept annotation in the CRAFT corpus
Michael Bada, Miriam Eckert, Donald Evans, Kristin Garcia, Krista Shipley, Dmitry Sitnikov, William A Baumgartner, K Bretonnel Cohen, Karin Verspoor, Judith A Blake, Lawrence E Hunter BMC Bioinformatics (2012-07-09) https://doi.org/gb8vdr
DOI: 10.1186/1471-2105-13-161 · PMID: 22776079 · PMCID: PMC3476437
25. DTMiner: identification of potential disease targets through biomedical literature mining
Dong Xu, Meizhuo Zhang, Yanping Xie, Fan Wang, Ming Chen, Kenny Q. Zhu, Jia Wei Bioinformatics (2016-08-09) https://doi.org/f9nw36
DOI: 10.1093/bioinformatics/btw503 · PMID: 27506226 · PMCID: PMC5181534
27. BioBERT: a pre-trained biomedical language representation model for biomedical text mining
Jinhyuk Lee, Wonjin Yoon, Sungdong Kim, Donghyeon Kim, Sunkyu Kim, Chan Ho So, Jaewoo Kang arXiv (2019-01-25) https://arxiv.org/abs/1901.08746v3
28. Distant Supervision for Large-Scale Extraction of Gene–Disease Associations from Literature Using DeepDive
Balu Bhasuran, Jeyakumar Natarajan International Conference on Innovative Computing and Communications (2018-11-20) https://doi.org/gf5hfv
DOI: 10.1007/978-981-13-2354-6_39
29. A new method for prioritizing drug repositioning candidates extracted by literature-based discovery
Majid Rastegar-Mojarad, Ravikumar Komandur Elayavilli, Dingcheng Li, Rashmi Prasad, Hongfang Liu 2015 IEEE International Conference on Bioinformatics and Biomedicine (BIBM) (2015-11) https://doi.org/gf479j
DOI: 10.1109/bibm.2015.7359766
30. Literature Mining for the Discovery of Hidden Connections between Drugs, Genes and Diseases
Raoul Frijters, Marianne van Vugt, Ruben Smeets, René van Schaik, Jacob de Vlieg, Wynand Alkema PLoS Computational Biology (2010-09-23) https://doi.org/bhrw7x
DOI: 10.1371/journal.pcbi.1000943 · PMID: 20885778 · PMCID: PMC2944780
31. Large-scale extraction of accurate drug-disease treatment pairs from biomedical literature for drug repurposing
Rong Xu, QuanQiu Wang BMC Bioinformatics (2013-06-06) https://doi.org/gb8v3k
DOI: 10.1186/1471-2105-14-181 · PMID: 23742147 · PMCID: PMC3702428
32. BioCreative V CDR task corpus: a resource for chemical disease relation extraction
Jiao Li, Yueping Sun, Robin J. Johnson, Daniela Sciaky, Chih-Hsuan Wei, Robert Leaman, Allan Peter Davis, Carolyn J. Mattingly, Thomas C. Wiegers, Zhiyong Lu Database (2016) https://doi.org/gf5hfw
DOI: 10.1093/database/baw068 · PMID: 27161011 · PMCID: PMC4860626
34. LimTox: a web tool for applied text mining of adverse event and toxicity associations of compounds, drugs and genes
Andres Cañada, Salvador Capella-Gutierrez, Obdulia Rabal, Julen Oyarzabal, Alfonso Valencia, Martin Krallinger Nucleic Acids Research (2017-05-22) https://doi.org/gf479h
DOI: 10.1093/nar/gkx462 · PMID: 28531339 · PMCID: PMC5570141
35. LPTK: a linguistic pattern-aware dependency tree kernel approach for the BioCreative VI CHEMPROT task
Neha Warikoo, Yung-Chun Chang, Wen-Lian Hsu Database (2018-01-01) https://doi.org/gfhjr6
DOI: 10.1093/database/bay108 · PMID: 30346607 · PMCID: PMC6196310
36. Extracting chemical–protein relations with ensembles of SVM and deep learning models
Yifan Peng, Anthony Rios, Ramakanth Kavuluru, Zhiyong Lu Database (2018-01-01) https://doi.org/gf479f
DOI: 10.1093/database/bay073 · PMID: 30020437 · PMCID: PMC6051439
37. Extracting chemical–protein interactions from literature using sentence structure analysis and feature engineering
Pei-Yau Lung, Zhe He, Tingting Zhao, Disa Yu, Jinfeng Zhang Database (2019-01-01) https://doi.org/gf479g
DOI: 10.1093/database/bay138 · PMID: 30624652 · PMCID: PMC6323317
38. Improving the learning of chemical-protein interactions from literature using transfer learning and specialized word embeddings
P Corbett, J Boyle Database (2018-01-01) https://doi.org/gf479d
DOI: 10.1093/database/bay066 · PMID: 30010749 · PMCID: PMC6044291
43. STRING v10: protein–protein interaction networks, integrated over the tree of life
Damian Szklarczyk, Andrea Franceschini, Stefan Wyder, Kristoffer Forslund, Davide Heller, Jaime Huerta-Cepas, Milan Simonovic, Alexander Roth, Alberto Santos, Kalliopi P. Tsafou, … Christian von Mering Nucleic Acids Research (2014-10-28) https://doi.org/f64rfn
DOI: 10.1093/nar/gku1003 · PMID: 25352553 · PMCID: PMC4383874
44. PPInterFinder—a mining tool for extracting causal relations on human proteins from literature
Kalpana Raja, Suresh Subramani, Jeyakumar Natarajan Database (2013-01-01) https://doi.org/gf479b
DOI: 10.1093/database/bas052 · PMID: 23325628 · PMCID: PMC3548331
45. HPIminer: A text mining system for building and visualizing human protein interaction networks and pathways
Suresh Subramani, Raja Kalpana, Pankaj Moses Monickaraj, Jeyakumar Natarajan Journal of Biomedical Informatics (2015-04) https://doi.org/f7bgnr
DOI: 10.1016/j.jbi.2015.01.006 · PMID: 25659452
46. Analyzing a co-occurrence gene-interaction network to identify disease-gene association
Amira Al-Aamri, Kamal Taha, Yousof Al-Hammadi, Maher Maalouf, Dirar Homouz BMC Bioinformatics (2019-02-08) https://doi.org/gf49nm
DOI: 10.1186/s12859-019-2634-7 · PMID: 30736752 · PMCID: PMC6368766
47. Comparative experiments on learning information extractors for proteins and their interactions
Razvan Bunescu, Ruifang Ge, Rohit J. Kate, Edward M. Marcotte, Raymond J. Mooney, Arun K. Ramani, Yuk Wah Wong Artificial Intelligence in Medicine (2005-02) https://doi.org/dhztpn
DOI: 10.1016/j.artmed.2004.07.016 · PMID: 15811782
48. BioInfer: a corpus for information extraction in the biomedical domain
Sampo Pyysalo, Filip Ginter, Juho Heimonen, Jari Björne, Jorma Boberg, Jouni Järvinen, Tapio Salakoski BMC Bioinformatics (2007-02-09) https://doi.org/b7bhhc
DOI: 10.1186/1471-2105-8-50 · PMID: 17291334 · PMCID: PMC1808065
49. Learning language in logic - genic interaction extraction challenge
C. Nédellec Proceedings of the learning language in logic 2005 workshop at the international conference on machine learning (2005)
51. Mining medline: Abstracts, sentences, or phrases?
Jing Ding, Daniel Berleant, Dan Nettleton, Eve Syrkin Wurtele Pacific symposium on biocomputing (2002) http://helix-web.stanford.edu/psb02/ding.pdf
52. Comparative analysis of five protein-protein interaction corpora
Sampo Pyysalo, Antti Airola, Juho Heimonen, Jari Björne, Filip Ginter, Tapio Salakoski BMC Bioinformatics (2008-04) https://doi.org/fh3df7
DOI: 10.1186/1471-2105-9-s3-s6 · PMID: 18426551 · PMCID: PMC2349296
53. Exploiting graph kernels for high performance biomedical relation extraction
Nagesh C. Panyam, Karin Verspoor, Trevor Cohn, Kotagiri Ramamohanarao Journal of Biomedical Semantics (2018-01-30) https://doi.org/gf49nn
DOI: 10.1186/s13326-017-0168-3 · PMID: 29382397 · PMCID: PMC5791373
55. Feature assisted stacked attentive shortest dependency path based Bi-LSTM model for protein–protein interaction
Shweta Yadav, Asif Ekbal, Sriparna Saha, Ankit Kumar, Pushpak Bhattacharyya Knowledge-Based Systems (2019-02) https://doi.org/gf4788
DOI: 10.1016/j.knosys.2018.11.020
56. Extraction of protein–protein interactions (PPIs) from the literature by deep convolutional neural networks with various feature embeddings
Sung-Pil Choi Journal of Information Science (2016-11) https://doi.org/gcv8bn
DOI: 10.1177/0165551516673485
57. Deep learning for extracting protein-protein interactions from biomedical literature
Yifan Peng, Zhiyong Lu arXiv (2017-06-05) https://arxiv.org/abs/1706.01556v2
59. The new NHGRI-EBI Catalog of published genome-wide association studies (GWAS Catalog)
Jacqueline MacArthur, Emily Bowler, Maria Cerezo, Laurent Gil, Peggy Hall, Emma Hastings, Heather Junkins, Aoife McMahon, Annalisa Milano, Joannella Morales, … Helen Parkinson Nucleic Acids Research (2016-11-29) https://doi.org/f9v7cp
DOI: 10.1093/nar/gkw1133 · PMID: 27899670 · PMCID: PMC5210590
60. DrugBank 5.0: a major update to the DrugBank database for 2018
David S Wishart, Yannick D Feunang, An C Guo, Elvis J Lo, Ana Marcu, Jason R Grant, Tanvir Sajed, Daniel Johnson, Carin Li, Zinat Sayeeda, … Michael Wilson Nucleic Acids Research (2017-11-08) https://doi.org/gcwtzk
DOI: 10.1093/nar/gkx1037 · PMID: 29126136 · PMCID: PMC5753335
65. Collaborative biocuration–text-mining development task for document prioritization for curation
T. C. Wiegers, A. P. Davis, C. J. Mattingly Database (2012-11-22) https://doi.org/gbb3zw
DOI: 10.1093/database/bas037 · PMID: 23180769 · PMCID: PMC3504477
66. The Stanford CoreNLP Natural Language Processing Toolkit
Christopher Manning, Mihai Surdeanu, John Bauer, Jenny Finkel, Steven Bethard, David McClosky Proceedings of 52nd Annual Meeting of the Association for Computational Linguistics: System Demonstrations (2014) https://doi.org/gf3xhp
DOI: 10.3115/v1/p14-5010
68. Snorkel MeTaL
Alex Ratner, Braden Hancock, Jared Dunnmon, Roger Goldman, Christopher Ré Proceedings of the Second Workshop on Data Management for End-To-End Machine Learning - DEEM’18 (2018) https://doi.org/gf3xk7
DOI: 10.1145/3209889.3209898 · PMID: 30931438 · PMCID: PMC6436830
69. A Proteome-Scale Map of the Human Interactome Network
Thomas Rolland, Murat Taşan, Benoit Charloteaux, Samuel J. Pevzner, Quan Zhong, Nidhi Sahni, Song Yi, Irma Lemmens, Celia Fontanillo, Roberto Mosca, … Marc Vidal Cell (2014-11) https://doi.org/f3mn6x
DOI: 10.1016/j.cell.2014.10.050 · PMID: 25416956 · PMCID: PMC4266588
71. Uncovering disease-disease relationships through the incomplete interactome
J. Menche, A. Sharma, M. Kitsak, S. D. Ghiassian, M. Vidal, J. Loscalzo, A.-L. Barabasi Science (2015-02-19) https://doi.org/f3mn6z
DOI: 10.1126/science.1257601 · PMID: 25700523 · PMCID: PMC4435741
72. Mining knowledge from MEDLINE articles and their indexed MeSH terms
Daniel Himmelstein, Alex Pankov ThinkLab (2015-05-10) https://doi.org/f3mqwp
DOI: 10.15363/thinklab.d67
73. Integrating resources with disparate licensing into an open network
Daniel Himmelstein, Lars Juhl Jensen, MacKenzie Smith, Katie Fortney, Caty Chung ThinkLab (2015-08-28) https://doi.org/bfmk
DOI: 10.15363/thinklab.d107
75. An analysis and metric of reusable data licensing practices for biomedical resources
Seth Carbon, Robin Champieux, Julie A. McMurry, Lilly Winfree, Letisha R. Wyatt, Melissa A. Haendel PLOS ONE (2019-03-27) https://doi.org/gf5m8v
DOI: 10.1371/journal.pone.0213090 · PMID: 30917137 · PMCID: PMC6436688
76. A Sensitivity Analysis of (and Practitioners’ Guide to) Convolutional Neural Networks for Sentence Classification
Ye Zhang, Byron Wallace arXiv (2015-10-13) https://arxiv.org/abs/1510.03820v4
78. Distributed Representations of Words and Phrases and their Compositionality
Tomas Mikolov, Ilya Sutskever, Kai Chen, Greg Corrado, Jeffrey Dean arXiv (2013-10-16) https://arxiv.org/abs/1310.4546v1
79. Enriching Word Vectors with Subword Information
Piotr Bojanowski, Edouard Grave, Armand Joulin, Tomas Mikolov arXiv (2016-07-15) https://arxiv.org/abs/1607.04606v2
80. Efficient Estimation of Word Representations in Vector Space
Tomas Mikolov, Kai Chen, Greg Corrado, Jeffrey Dean arXiv (2013-01-16) https://arxiv.org/abs/1301.3781v3
81. On Calibration of Modern Neural Networks
Chuan Guo, Geoff Pleiss, Yu Sun, Kilian Q. Weinberger arXiv (2017-06-14) https://arxiv.org/abs/1706.04599v2
82. Accurate Uncertainties for Deep Learning Using Calibrated Regression
Volodymyr Kuleshov, Nathan Fenner, Stefano Ermon arXiv (2018-07-01) https://arxiv.org/abs/1807.00263v1
Supplemental Methods
Label Function Categories
We provide examples of label function categories below. Each example regards the following candidate sentence: “PTK6 may be a novel therapeutic target for pancreatic cancer.”
Databases: These label functions incorporate existing databases to generate a signal, as seen in distant supervision [4]. These functions detect if a candidate sentence’s co-mention pair is present in a given database. If the candidate pair is present, our label function emitted a positive label and abstained otherwise. If the candidate pair wasn’t present in any existing database, a separate label function emitted a negative label. We used a separate label function to prevent a label imbalance problem that we encountered during development: emitting positive and negatives from the same label functions appeared to result in classifiers that predict almost exclusively negative predictions.
Text Patterns: These label functions are designed to use keywords and sentence context to generate a signal. For example, a label function could focus on the number of words between two mentions or focus on the grammatical structure of a sentence. These functions emit a positive or negative label depending on the situation.
Domain Heuristics: These label functions use the other experiment results to generate a signal. For this category, we used dependency path cluster themes generated by Percha et al. [18]. If a candidate sentence’s dependency path belongs to a previously generated cluster, then the label function will emit a positive label and abstain otherwise.
Roughly half of our label functions are based on text patterns, while the others are distributed across the databases and domain heuristics (Table 2).
Table 2: The distribution of each label function per relationship.
Relationship
Databases (DB)
Text Patterns (TP)
Domain Heuristics (DH)
DaG
7
20
10
CtD
3
15
7
CbG
9
13
7
GiG
9
20
8
Adding Random Noise to Generative Model
We discovered in the course of this work that adding a single label function from a mismatched type would often improve the performance of the generative model (see Results). We designed an experiment to test whether adding a noisy label function also increased performance. This label function emitted a positive or negative label at varying frequencies, which were evenly spaced from zero to one. Zero was the same as distant supervision and one meant that all sentences were randomly labeled. We trained the generative model with these label functions added and reported results in terms of AUROC and AUPR.
Discriminative Model
The discriminative model is a neural network, which we train to predict labels from the generative model. The expectation is that the discriminative model can learn more complete features of the text than the label functions used in the generative model. We used a convolutional neural network with multiple filters as our discriminative model. This network uses multiple filters with fixed widths of 300 dimensions and a fixed height of 7 (Figure 4), because this height provided the best performance in terms of relationship classification [76]. We trained this model for 20 epochs using the adam optimizer [77] with pytorch’s default parameter settings and a learning rate of 0.001. We added a L2 penalty on the network weights to prevent overfitting. Lastly, we added a dropout layer (p=0.25) between the fully connected layer and the softmax layer.
Figure 4: The architecture of the discriminative model was a convolutional neural network. We performed a convolution step using multiple filters. The filters generated a feature map that was sent into a maximum pooling layer that was designed to extract the largest feature in each map. The extracted features were concatenated into a singular vector that was passed into a fully connected network. The fully connected network had 300 neurons for the first layer, 100 neurons for the second layer and 50 neurons for the last layer. The last step from the fully connected network was to generate predictions using a softmax layer.
Word Embeddings
Word embeddings are representations that map individual words to real valued vectors of user-specified dimensions. These embeddings have been shown to capture the semantic and syntactic information between words [78]. We trained Facebook’s fastText [79] using all candidate sentences for each individual relationship pair to generate word embeddings. fastText uses a skipgram model [80] that aims to predict the surrounding context for a candidate word and pairs the model with a novel scoring function that treats each word as a bag of character n-grams. We trained this model for 20 epochs using a window size of 2 and generated 300-dimensional word embeddings. We use the optimized word embeddings to train a discriminative model.
Calibration of the Discriminative Model
Often many tasks require a machine learning model to output reliable probability predictions. A model is well calibrated if the probabilities emitted from the model match the observed probabilities: a well-calibrated model that assigns a class label with 80% probability should have that class appear 80% of the time. Deep neural network models can often be poorly calibrated [81,82]. These models are usually over-confident in their predictions. As a result, we calibrated our convolutional neural network using temperature scaling. Temperature scaling uses a parameter T to scale each value of the logit vector (z) before being passed into the softmax (SM) function.
We found the optimal T by minimizing the negative log likelihood (NLL) of a held out validation set. The benefit of using this method is that the model becomes more reliable and the accuracy of the model doesn’t change [81].
Supplemental Tables and Figures
Generative Model AUPR Performance
Figure 5: Grid of AUPR scores for each generative model trained on randomly sampled label functions. The rows depict the relationship each model is trying to predict and the columns are the edge type specific sources from which each label function is sampled. For example, the top-left most square depicts the generative model predicting DaG sentences, while randomly sampling label functions designed to predict the DaG relationship. The square towards the right depicts the generative model predicting DaG sentences, while randomly sampling label functions designed to predict the CtD relationship. This pattern continues filling out the rest of the grid. The right most column consists of pooling every relationship specific label function and proceeding as above.
Random Label Function Generative Model Analysis
Figure 6: A grid of AUROC (A) scores for each edge type. Each plot consists of adding a single label function on top of the baseline model. This label function emits a positive (shown in blue) or negative (shown in orange) label at specified frequencies, and performance at zero is equivalent to not having a randomly emitting label function. The error bars represent 95% confidence intervals for AUROC or AUPR (y-axis) at each emission frequency.
Discriminative Model Performance
Figure 7: Grid of AUROC scores for each discriminative model trained using generated labels from the generative models. The rows depict the edge type each model is trying to predict and the columns are the edge type specific sources from which each label function was sampled. For example, the top-left most square depicts the discriminator model predicting DaG sentences, while randomly sampling label functions designed to predict the DaG relationship. The error bars over the points represents the standard deviation between sampled runs. The square towards the right depicts the discriminative model predicting DaG sentences, while randomly sampling label functions designed to predict the CtD relationship. This pattern continues filling out the rest of the grid. The right most column consists of pooling every relationship specific label function and proceeding as above.
In this framework we used a generative model trained over label functions to produce probabilistic training labels for each sentence. Then we trained a discriminative model, which has full access to a representation of the text of the sentence, to predict the generated labels. The discriminative model is a convolutional neural network trained over word embeddings (See Methods). We report the results of the discriminative model using AUROC and AUPR (Figures 7 and 8).
We found that the discriminative model under-performed the generative model in most cases. Only for the CtD edge does the discriminative model appear to provide performance above the generative model and that increased performance is only with a modest number of label functions. With the full set of label functions, performance of both models remain similar. The one or a few mismatched label functions (off-diagonal) improving generative model performance trend is retained despite the limited performance of the discriminative model.
Figure 8: Grid of AUPR scores for each discriminative model trained using generated labels from the generative models. The rows depict the edge type each model is trying to predict and the columns are the edge type specific sources from which each label function was sampled. For example, the top-left most square depicts the discriminator model predicting DaG sentences, while randomly sampling label functions designed to predict the DaG relationship. The error bars over the points represents the standard deviation between sampled runs. The square towards the right depicts the discriminative model predicting DaG sentences, while randomly sampling label functions designed to predict the CtD relationship. This pattern continues filling out the rest of the grid. The right most column consists of pooling every relationship specific label function and proceeding as above.
Discriminative Model Calibration
Figure 9: Calibration plots for the discriminative model. A perfectly calibrated model would follow the dashed diagonal line. The blue line represents the predictions before calibration and the orange line shows predictions after calibration.
Even deep learning models with high precision and recall can be poorly calibrated, and the overconfidence of these models has been noted [81,82]. We attempted to calibrate the best performing discriminative model so that we could directly use the emitted probabilities. We examined the calibration of our existing model (Supplemental Figure 9, blue line). We found that the DaG and CtG edge types were, though not perfectly calibrated, were somewhat aligned with the ideal calibration lines. The CbG and GiG edges were poorly calibrated and increasing model certainty did not always lead to an increase in precision. Applying the calibration algorithm (orange line) did not appear to bring predictions in line with the ideal calibration line, but did capture some of the uncertainty in the GiG edge type. For this reason we use the measured precision instead of the predicted probabilities when determining how many edges could be added to existing knowledge bases with specified levels of confidence.
Model Calibration Tables
Table 3: Contains the top ten Disease-associates-Gene confidence scores before and after model calbration. Disease mentions are highlighted in brown and Gene mentions are highlighted in blue.
Disease Name
Gene Symbol
Text
Before Calibration
After Calibraiton
adrenal gland cancer
TP53
the mechanisms of adrenal tumorigenesis remain poorly established ; the r337h germline mutation in the p53 gene has previously been associated with acts in brazilian children .
1.0
0.882
breast cancer
ERBB2
in breast cancer , overexpression of her2 is associated with an aggressive tumor phenotype and poor prognosis .
1.0
0.845
lung cancer
TP53
however , both adenine ( a ) and guanine ( g ) mutations are found in the p53 gene in cr exposure-related lung cancer .
1.0
0.83
malignant glioma
BAX
these data suggest that the combination of tra-8 treatment with specific overexpression of bax using advegfbax may be an effective approach for the treatment of human malignant gliomas .
0.999
0.827
polycystic ovary syndrome
SERPINE1
4 g allele in pai-1 gene was more frequent in pcos and the 4g/4 g genotype was associated with increased pai-1 levels .
0.999
0.814
systemic lupus erythematosus
PRL
results : sle patients showed a significantly higher serum level of prl than healthy subjects , which was especially obvious in the active stage of the disease ( p = 0.000 .
0.999
0.813
hematologic cancer
TNF
the mean tnf-alpha plasma concentration in the patients with cll was significantly higher than in the healthy control population ( 16.4 versus 8.7 pg/ml ; p < .0001 ) .
0.999
0.81
lung cancer
MUC16
the mean concentration of ca 125 was higher in patients with lung cancer ( 37 + / - 81 u/ml ) than in those with nonmalignant disease ( 4.2 + / - 5.7 u/ml ) ( p less than 0.01 ) .
0.999
0.806
prostate cancer
AR
the androgen receptor was expressed in all primary and metastatic prostate cancer tissues and no mutations were identified .
0.999
0.801
breast cancer
ERBB2
the results of multiple linear regression analysis , with her2 as the dependent variable , showed that family history of breast cancer was significantly associated with elevated her2 levels in the tumors ( p = 0.0038 ) , after controlling for the effects of age , tumor estrogen receptor , and dna index .
0.999
0.8
Table 4: Contains the bottom ten Disease-associates-Gene confidence scores before and after model calbration. Disease mentions are highlighted in brown and Gene mentions are highlighted in blue.
Disease Name
Gene Symbol
Text
Before Calibration
After Calibraiton
breast cancer
NAT2
[ the relationship between passive smoking , breast cancer risk and n-acetyltransferase 2 ( nat2 ) ] .
0.012
0.287
schizophrenia
EP300
ventricle size and p300 in schizophrenia .
0.012
0.286
hematologic cancer
CD33
in the 2 ( nd ) study of cd33 + sr-aml 2 doses of go ( 4.5 - 9 mg/m ( 2 ) ) were administered > = 60d post reduced intensity conditioning ( ric ) allosct ( 8 wks apart ) .
0.01
0.281
Crohn’s disease
PTPN2
in this sample , we were able to confirm an association between cd and ptpn2 ( genotypic p = 0.019 and allelic p = 0.011 ) , and phenotypic analysis showed an association of this snp with late age at first diagnosis , inflammatory and penetrating cd behaviour , requirement of bowel resection and being a smoker at diagnosis .
0.008
0.268
breast cancer
ERBB2
long-term efficacy and safety of adjuvant trastuzumab for her2-positive early [breast cancer ] .
0.007
0.262
hematologic cancer
CD40LG
we examined the direct effect of lenalidomide on cll-cell proliferation induced by cd154-expressing accessory cells in media containing interleukin-4 and -10 .
0.006
0.259
hematologic cancer
MLANA
methods : the sln sections ( n = 214 ) were assessed by qrt assay for 4 established messenger rna biomarkers : mart-1 , mage-a3 , galnac-t , and pax3 .
0.005
0.252
breast cancer
ERBB2
the keywords erbb2 or her2 or erbb-2 or her-2 and breast cancer and ( country ) were used to search pubmed , international and local conference abstracts and local-language journals from the year 2000 onwards .
0.003
0.225
hepatitis B
PKD2
conversely , a significant enhancement of activation was observed for afb1 in cases of mild cah and especially for trp-p-2 in hepatitis b virus carriers , irrespective of their histologic diagnosis .
0.002
0.217
hematologic cancer
C7
serum antibody responses to four haemophilus influenzae type b capsular polysaccharide-protein conjugate vaccines ( prp-d , hboc , c7p , and prp-t ) were studied and compared in 175 infants , 85 adults and 140 2-year-old children .
0.002
0.208
Table 5: Contains the top ten Compound-treats-Disease confidence scores after model calbration. Disease mentions are highlighted in brown and Compound mentions are highlighted in red.
Compound Name
Disease Name
Text
Before Calibration
After Calibration
Methylprednisolone
asthma
use of tao without methylprednisolone in the treatment of severe asthma .
1.0
0.895
Methyldopa
hypertension
atenolol and methyldopa in the treatment of hypertension .
1.0
0.888
Prednisone
asthma
prednisone and beclomethasone for treatment of asthma .
1.0
0.885
Prazosin
hypertension
experience with prazosin in the treatment of hypertension .
1.0
0.883
Prazosin
hypertension
prazosin in the treatment of hypertension .
1.0
0.878
Prazosin
hypertension
prazosin in the treatment of [hypertension ] .
1.0
0.878
Methyldopa
hypertension
oxprenolol plus cyclopenthiazide-kcl versus methyldopa in the treatment of hypertension .
1.0
0.877
Prednisolone
lymphatic system cancer
peptichemio : a new oncolytic drug in combination with vincristine and prednisolone in the treatment of non-hodgkin lymphomas .
1.0
0.871
Methyldopa
hypertension
methyldopate , the ethyl ester hydrochloride salt of alpha-methyldopa ( alpha-md ) , is used extensively in the treatment of severe hypertension .
1.0
0.851
Haloperidol
Gilles de la Tourette syndrome
a comparison of pimozide and haloperidol in the treatment of gilles de la tourette ’s syndrome .
1.0
0.839
Table 6: Contains the bottom ten Compound-treats-Disease confidence scores before and after model calbration. Disease mentions are highlighted in brown and Compound mentions are highlighted in red.
Compound Name
Disease Name
Text
Before Calibration
After Calibration
Dexamethasone
hypertension
dexamethasone and hypertension in preterm infants .
0.011
0.34
Reserpine
hypertension
reserpine in hypertension : present status .
0.01
0.336
Creatine
coronary artery disease
scintiphotographic findings were compared with the size of myocardial infarcts calculated from measurements of the activity of mb isoenzymes of creatine kinase ( ck-mb ) in serum and in the myocardium at autopsy , as described by sobel ’s method .
0.009
0.334
Hydrocortisone
brain cancer
to explore the effects of repeated episodes of hypercortisolemia on hypothalamic-pituitary-adrenal axis regulation , we studied plasma acth and cortisol ( cort ) responses to 100 micrograms human crh ( hcrh ) in 10 dexamethasone ( 1.5 mg ) - pretreated elderly endurance athletes who had abstained from physical activity for at least 48 h before testing and 13 sedentary age-matched controls .
0.009
0.333
Hydrocortisone
brain cancer
basal activity of the hypothalamic-pituitary-adrenal axis was estimated by determinations of 24-h urinary free cortisol-excretion , evening basal plasma total and free cortisol concentrations , and the cortisol binding globulin-binding capacity .
0.008
0.328
Creatine
coronary artery disease
during successful and uncomplicated angioplasty ( ptca ) , we studied the effect of a short lasting myocardial ischemia on plasma creatine kinase , creatine kinase mb-activity , and creatine kinase mm-isoforms ( mm1 , mm2 , mm3 ) in 23 patients .
0.006
0.318
Benzylpenicillin
epilepsy syndrome
it was shown in experiments on cats under nembutal anesthesia that a lesion of the medial forebrain bundle ( mfb ) and partly of the preoptic region at the side of local penicillin application on the cerebral cortex ( g. suprasylvius medius ) results in depression of the epileptiform activity in the penicillin-induced focus , as well as in the secondary `` mirror ’’ focus , which appeared in the symmetrical cortex area of the other hemisphere .
0.005
0.315
Indomethacin
hypertension
effects of indomethacin in rabbit renovascular hypertension .
0.004
0.308
Cyclic Adenosine Monophosphate
ovarian cancer
the hormonal regulation of steroidogenesis and adenosine 3 ’ :5 ’ - cyclic monophosphate in embryonic-chick ovary .
0.002
0.292
Dobutamine
coronary artery disease
two-dimensional echocardiography can detect regional wall motion abnormalities resulting from myocardial ischemia produced by dobutamine infusion .
0.002
0.287
Table 7: Contains the top ten Compound-treats-Disease confidence scores before and after model calbration. Gene mentions are highlighted in blue and Compound mentions are highlighted in red.
Compound Name
Gene Symbol
Text
Before Calibration
After Calibration
Hydrocortisone
SHBG
serum concentrations of testicular and adrenal androgens and androgen precursors , cortisol , unconjugated ( e1 ) and total estrone ( te1 ; greater than or equal to 85 % e1 sulfate ) , pituitary hormones , sex hormone binding globulin ( shbg ) and albumin were measured in 14 male patients with non-diabetic end stage renal disease and in 28 age-matched healthy controls .
0.997
0.745
Minoxidil
EGFR
direct measurement of the ability of minoxidil to compete for binding to the egf receptor indicated that minoxidil probably does not bind to the egf receptor .
cholecalciferol ( vitamin d3 ) and its 25-hydroxy metabolite are transported in plasma bound to a specific protein , the binding protein for cholecalciferol and its metabolites ( dbp ) .
0.983
0.685
Indomethacin
AGT
indomethacin , a potent inhibitor of prostaglandin synthesis , is known to increase the maternal blood pressure response to angiotensin ii infusion .
0.982
0.68
Tretinoin
RXRA
the vitamin a derivative retinoic acid exerts its effects on transcription through two distinct classes of nuclear receptors , the retinoic acid receptor ( rar ) and the retinoid x receptor ( rxr ) .
0.975
0.668
Dopamine
NTS
neurotensin binding was not modified by the addition of dopamine .
0.97
0.659
D-Tyrosine
PLCG1
epidermal growth factor ( egf ) or platelet-derived growth factor binding to their receptor on fibroblasts induces tyrosine phosphorylation of plc gamma 1 and stable association of plc gamma 1 with the receptor protein tyrosine kinase .
0.969
0.659
D-Tyrosine
PLCG1
tyrosine phosphorylation of plc-ii was stimulated by low physiological concentrations of egf ( 1 nm ) , was quantitative , and was already maximal after a 30 sec incubation with 50 nm egf at 37 degrees c. interestingly , antibodies specific for plc-ii were able to coimmunoprecipitate the egf receptor and antibodies against egf receptor also coimmunoprecipitated plc-ii .
0.964
0.651
Ketamine
C5
additionally , reduction of glycine binding by the c-5 antagonists was reversed by both nmda receptor agonists and c-7 competitive nmda antagonists , providing evidence that the site of action of these c-5 antagonists is the nmda recognition site , resulting in indirect modulation of the glycine site .
0.957
0.643
Table 8: Contains the bottom ten Compound-binds-Gene confidence scores before and after model calbration. Gene mentions are highlighted in blue and Compound mentions are highlighted in red.
Compound Name
Gene Symbol
Text
Before Calibration
After Calibration
Iron
NDUFB3
since gastric acid plays an important role in the absorption process of iron and vitamin b12 , we determined levels of iron , ferritin , vitamin b12 , and folic acid in 75 serum samples obtained during continuous omeprazole therapy ( 6-48 months after start of therapy ) from 34 patients with peptic diseases ( primarily reflux esophagitis ) .
0.006
0.276
D-Tyrosine
PLAU
either the 55 kda u-pa form and the lower mw form ( 33 kda ) derived from the 55 kda u-pa are tyr-phosphorylated also the u-pa secreted in the culture media of human fibrosarcoma cells ( ht-1080 ) is phosphorylated in tyrosine as well as u-pa present in tissue extracts of tumors induced in nude mice by ht-1080 cells .
0.006
0.276
D-Leucine
POMC
cross-reactivities of leucine-enkephalin and beta-endorphin with the eia were less than 0.1 % , while that with gly-gly-phe-met and oxidized gly-gly-phe-met were 2.5 % and 10.2 % , respectively .
0.006
0.273
Eprazinone
GAST
in patients with renal failure there exists the inhibition of the gastrin acid secretion which is the cause of the weakening of the mechanism of the feedback connection between hcl and gastrin , while because of a permanent stimulation of g-cells , the hyperplasia of these cells develops , as well as the increased secretory activity , and hypergastrinemia .
0.005
0.271
Hydrocortisone
GH1
luteinizing hormone responses to luteinizing hormone releasing hormone , and growth hormone and cortisol responses to insulin induced hypoglycaemia in functional secondary amenorrhoea .
0.005
0.271
Hydrocortisone
GH1
group iv patients had normal basal levels of lh and normal lh , gh and cortisol responses .
0.005
0.269
Bupivacaine
AVP
plasma renin activity and vasopressin concentration , arterial pressure , and serum osmolality were measured in 17 patients before and after random epidural injection of either 6.7 ml of 0.75 % bupivacaine ( n = 7 ) or the same volume of saline ( n = 10 ) .
0.004
0.26
Epinephrine
INS
thermogenic effect of thyroid hormones : interactions with epinephrine and insulin .
0.004
0.259
Hydrocortisone
GH1
cortisol and growth hormone ( gh ) secretion ( spontaneous variations at night and the release induced by insulin hypoglycaemia ) were investigated in 69 children and adolescents .
0.002
0.241
Estriol
LGALS1
[ diagnostic value of serial determination of estriol and hpl in plasma and of total estrogens in 24-h-urine compared to single values for diagnosis of fetal danger ] .
0.0
0.181
Table 9: Contains the top ten Gene-interacts-Gene confidence scores before and after model calbration. Both gene mentions highlighted in blue.
Gene1 Symbol
Gene2 Symbol
Text
Before Calibration
After Calibration
INS
HSPA4
conclusions : intact insulin only weakly interacts with the hsp70 chaperone dnak whereas monomeric proinsulin and peptides from 3 distinct proinsulin regions show substantial chaperone binding .
0.834
0.574
NMT1
S100B
values for k ( cat ) indicated that , once gag or nef binds to the enzyme , myristoylation by nmt1 and nmt2 proceeds at comparable rates .
0.826
0.571
VEGFA
HIF1A
mechanistically , we demonstrated that resveratrol inhibited hif-1alpha and vegf expression through multiple mechanisms .
0.82
0.569
ITGAV
PECAM1
antigens expressed on emp and ec were assayed flow cytometrically and included constitutive markers ( cd31 , cd51/61 , cd105 ) , inducible markers ( cd54 , cd62e and cd106 ) , and annexin v binding .
0.81
0.566
F10
PF4
these compounds inhibit both factor xa and thrombin , in the presence of antithrombin , while they are devoid of undesirable non-specific interactions , particularly with platelet factor 4 ( pf4 ) .
0.766
0.554
NFKB2
RELB
the results indicate that dystrophic muscle is characterized by increases in the whole cell expression of ikappab-alpha , p65 , p50 , relb , p100 , p52 , ikk , and traf-3 .
0.76
0.553
SSSCA1
CDKN1B
conclusion : hl-60 / ht cells have lower p27 (kip1 ) expression compared with hl-60 cells .
0.757
0.552
PTH2R
PTH2
thus , the juxtamembrane receptor domain specifies the signaling and binding selectivity of tip39 for the pth2 receptor over the pth1 receptor .
0.749
0.55
MMP9
MMP2
all these factors markedly influenced the secretion and/or activation of mmp-2 and mmp-9 .
0.738
0.547
CCND1
ABL1
synergy with v-abl depended on a motif in cyclin d1 that mediates its binding to the retinoblastoma protein , suggesting that abl oncogenes in part mediate their mitogenic effects via a retinoblastoma protein-dependent pathway .
0.736
0.547
Table 10: Contains the bottom ten Gene-interacts-Gene confidence scores before and after model calbration. Both gene mentions highlighted in blue.
Gene1 Symbol
Gene2 Symbol
Text
Before Calibration
After Calibration
IFNG
IL6
in the control group , the positive rate for il-4 , il-6 , il-10 were 0/10 , 2/10 and 1/10 , respectively , and those for il-2 and ifn-gamma were both 1/10 .
0.012
0.306
ACHE
BCHE
anticholinesterase activity was determined against acetylcholinesterase ( ache ) and butyrylcholinesterase ( bche ) , the enzymes vital for alzheimer ’s disease , at 50 , 100 and 200 g ml ( -1 ) .
0.011
0.306
CCL2
AGT
we found no significant increase in mcp-1 concentrations by ang ii alone ; but it enhanced the tnf-alpha-induced mcp-1 mrna expression in a dose-dependent manner .
0.011
0.306
CXCL8
IL1B
furthermore , somatostatin completely abrogated the increased secretion of il-8 and il-1beta after invasion by salmonella .
0.011
0.303
SULT1A2
SULT1A3
to date , the laboratory has cloned seven unique human sulfotransferases ; five aryl sulfotransferases ( hast1 , hast2 , hast3 , hast4 and hast4v ) , an estrogen sulfotransferase and a dehydroepiandrosterone sulfotransferase .
0.009
0.295
IFNG
IL10
results : we found weak mrna expression of interleukin-4 ( il-4 ) and il-5 , and strong expression of il-6 , il-10 and ifn-gamma before therapy .
0.008
0.292
IL2
IFNG
prostaglandin e2 at priming of naive cd4 + t cells inhibits acquisition of ability to produce ifn-gamma and il-2 , but not il-4 and il-5 .
0.007
0.289
IL2
IFNG
the detailed distribution of lymphokine-producing cells showed that il-2 and ifn-gamma-producing cells were located mainly in the follicular areas .
0.007
0.287
IL2
IFNG
pbl of ms patients produced more pro-inflammatory cytokines , il-2 , ifn-gamma and tnf/lymphotoxin , and less anti-inflammatory cytokine , tgf-beta , during wk 2 to 4 in culture than pbl of normal controls .
0.006
0.283
NFKB1
TNF
nf-kappab-dependent reporter gene transcription activated by tnf was also suppressed by calagualine .
0.005
0.276
Baseline Comparison
Figure 10: Comparion between our model and CoCoScore model [13]. We report both model’s performance in terms of AUROC and AUPR. Our model achieves comparable performance against CoCoScore in terms of AUROC. As for AUPR, CoCoScore consistently outperforms our model except for CtD.
Once our discriminator model is calibrated, we grouped sentences based on mention pair (edges). We assigned each edge the maximum score over all grouped sentences and compared our model’s ability to predict pairs in our test set to a previously published baseline model [13]. Performance is reported in terms of AUROC and AUPR (Figure 10). Across edge types our model shows comparable performance against the baseline in terms of AUROC. Regarding AUPR, our model shows hindered performance against the baseline. The exception for both cases is CtD where our model performs better than the baseline.
Reconstructing Hetionet
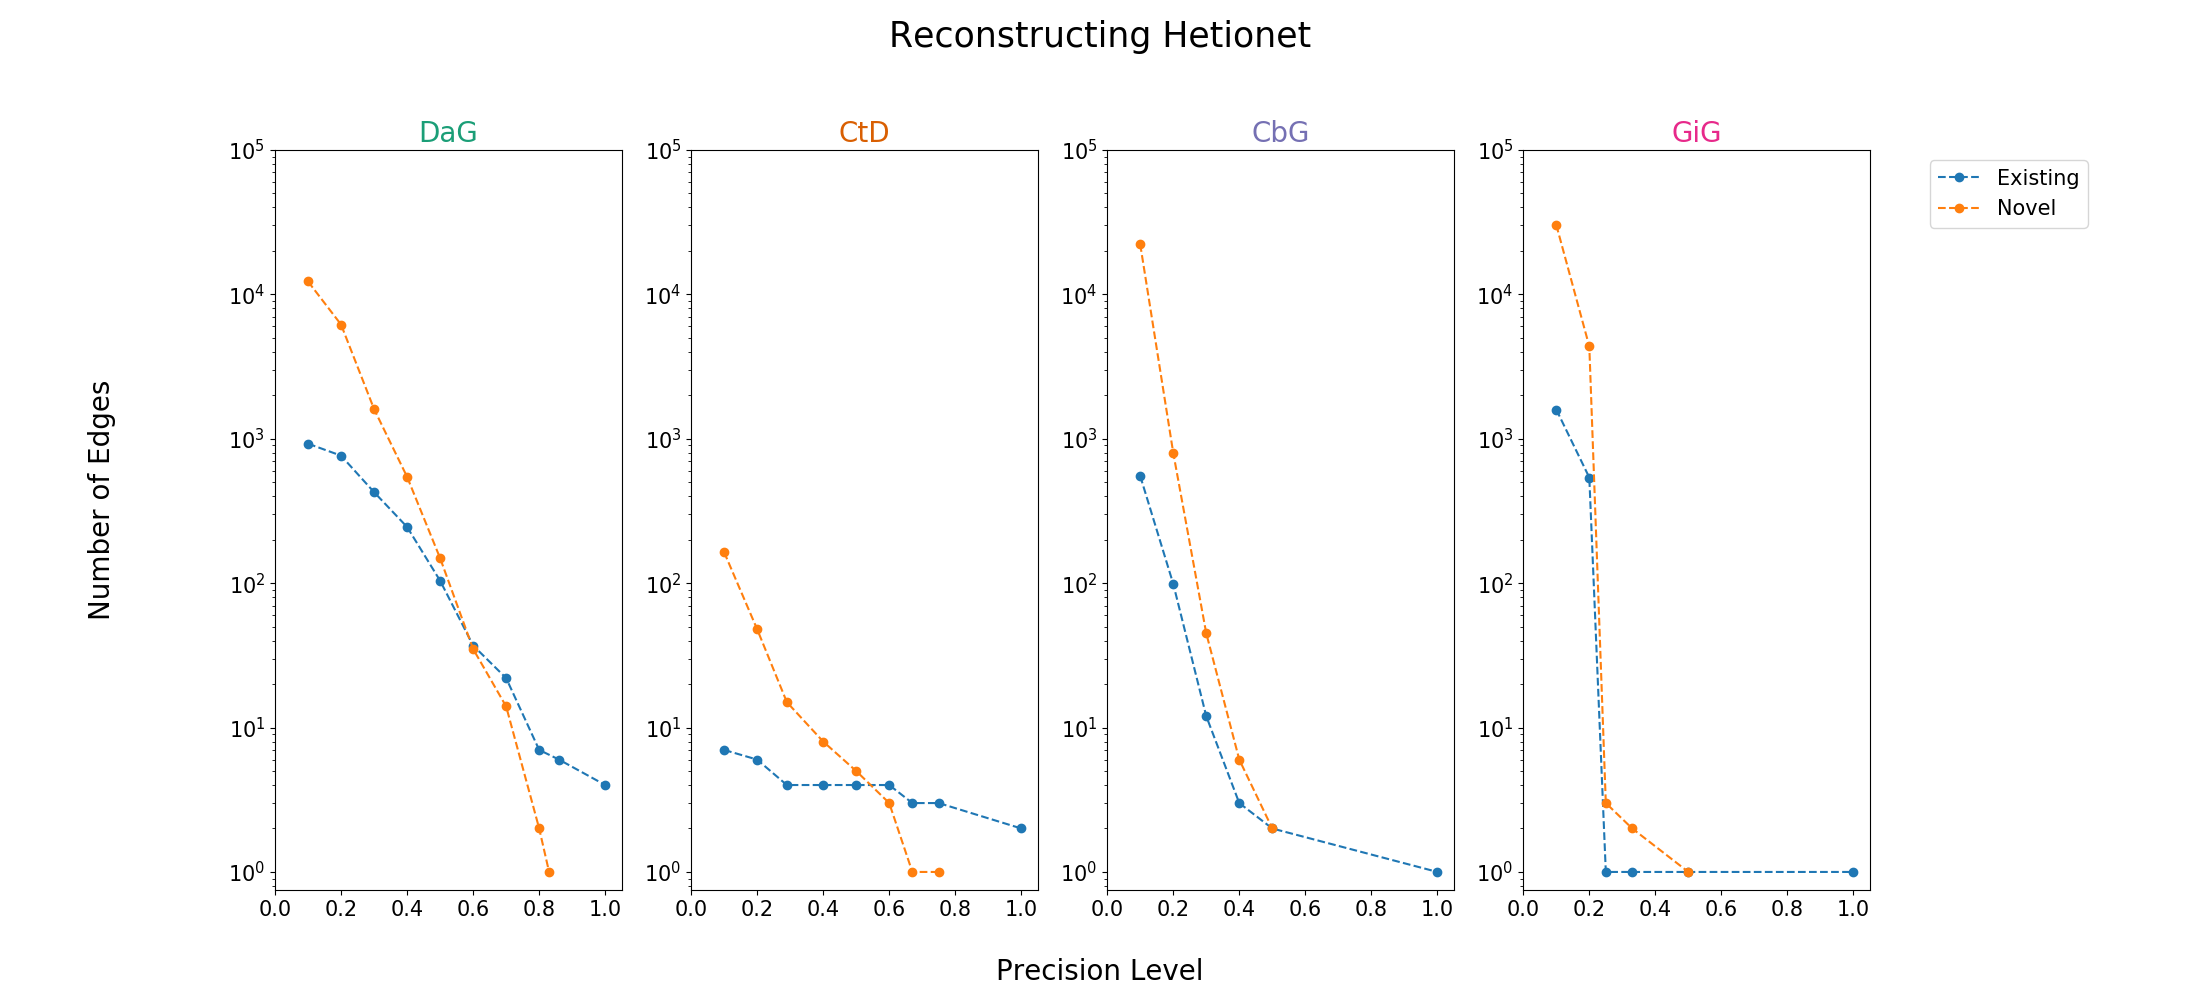
Figure 11: A scatter plot showing the number of edges (log scale) we can add or recall at specified precision levels. The blue depicts edges existing in hetionet and the orange depicts how many novel edges can be added.
We evaluated how many edges we can recall/add to Hetionet v1 (Supplemental Figure 11 and Table 11). In our evaluation we used edges assigned to our test set. Overall, we can recall a small amount of edges at high precision thresholds. A key example is CbG and GiG where we recalled only one exisiting edge at 100% precision. Despite the low recall, we are still able to add novel edges to DaG and CtD while retaining modest precision.
Table 11: Contains the top ten predictions for each edge type. Highlighted words represent entities mentioned within the given sentence.
Edge Type
Source Node
Target Node
Gen Model Prediction
Disc Model Prediction
Number of Sentences
Text
DaG
lung cancer
VEGFA
1.000
0.912
3293
conclusion : the plasma vegf level is increased in nsclc patients with approximate1y one fourth to have cancer cells in the peripheral blood.
DaG
hematologic cancer
TP53
1.000
0.905
8660
mutations of the p53 gene were found in four cases of cml in blastic crisis ( bc ).
DaG
obesity
MC4R
1.000
0.901
1493
several mutations in the melanocortin 4 receptor gene are associated with obesity in chinese children and adolescents.
DaG
Alzheimer’s disease
VLDLR
1.000
0.886
86
the 5-repeat allele in the very-low-density lipoprotein receptor gene polymorphism is not increased in sporadic alzheimer ’s disease in japanese.
DaG
lung cancer
XRCC1
1.000
0.885
662
results : xrcc1 gene polymorphism is associated with increased risk of lung cancer when the arg/arg genotype was used as the reference group.
DaG
prostate cancer
ESR1
1.000
0.883
500
conclusion : these results suggest that variants of the ggga polymorphism from the estrogen receptor alpha gene may be associated with an increased risk of developing prostate cancer.
DaG
breast cancer
REG1A
1.000
0.878
37
conclusion : high levels of reg1a expression within tumors are an independent predictor of poor prognosis in patients with breast cancer.
DaG
breast cancer
INSR
1.000
0.877
200
we have previously reported that insulin receptor expression is increased in human breast cancer specimens ( v. papa et al. , j. clin.
DaG
rheumatoid arthritis
AR
1.000
0.877
53
conclusion : our results suggest no correlation between cag repeat polymorphism in the ar gene and response to treatment with lef in women with ra.
DaG
coronary artery disease
CTLA4
1.000
0.875
12
conclusion : the g/g genotype polymorphism of the ctla-4 gene is associated with increased risk of ami.
CtD
Zonisamide
epilepsy syndrome
1.000
0.943
1011
adjunctive zonisamide therapy in the long-term treatment of children with partial epilepsy : results of an open-label extension study of a phase iii , randomized , double-blind , placebo-controlled trial.
CtD
Metformin
polycystic ovary syndrome
1.000
0.942
3217
in the present study , 23 pcos subjects [ mean ( + / - se ) body mass index 30.0 + / -1.1 kg/m2 ] were randomly assigned to double-blind treatment with metformin ( 500 mg tid ) or placebo for 6 months , while maintaining their usual eating habits.
CtD
Piroxicam
rheumatoid arthritis
1.000
0.928
184
methods : a double-blind , randomized , crossover trial in 49 patients with active ra compared 6 weeks of treatment with tenidap ( 120 mg/day ) versus 6 weeks of treatment with piroxicam ( 20 mg/day ).
CtD
Irinotecan
stomach cancer
1.000
0.918
968
randomized phase ii trial of first-line treatment with tailored irinotecan and s-1 therapy versus s-1 monotherapy for advanced or recurrent gastric carcinoma ( jfmc31-0301 ).
CtD
Treprostinil
hypertension
1.000
0.913
536
oral treprostinil for the treatment of pulmonary arterial hypertension in patients receiving background endothelin receptor antagonist and phosphodiesterase type 5 inhibitor therapy ( the freedom-c2 study ) : a randomized controlled trial.
CtD
Colchicine
gout
1.000
0.911
78
this is the first in vivo data to provide a biological rationale that supports the implementation of low dose , non-toxic , colchicine therapy for the treatment of gouty arthritis.
CtD
Propranolol
stomach cancer
1.000
0.898
45
74 cirrhotic patients with a history of variceal or gastric bleeding were randomly assigned to treatment with propranolol ( 40 to 360 mg/day ) or placebo.
CtD
Reboxetine
endogenous depression
1.000
0.894
439
data were obtained from four short-term ( 4-8-week ) , randomized , placebo-controlled trials of reboxetine for the treatment of mdd.
CtD
Diclofenac
ankylosing spondylitis
1.000
0.892
61
comparison of two different dosages of celecoxib with diclofenac for the treatment of active ankylosing spondylitis : results of a 12-week randomised , double-blind , controlled study.
CtD
Tapentadol
osteoarthritis
1.000
0.880
29
driving ability in patients with severe chronic low back or osteoarthritis knee pain on stable treatment with tapentadol prolonged release : a multicenter , open-label , phase 3b trial.
CbG
Dexamethasone
NR3C1
1.000
0.850
1119
submicromolar free calcium modulates dexamethasone binding to the glucocorticoid receptor.
CbG
Vitamin A
RBP4
1.000
0.807
5512
the authors give serum retinol binding protein ( rbp ) normal values , established by immunonephelometry , for two healthy populations in their hospital laboratory.
CbG
D-Proline
IGFBP4
1.000
0.790
1
the insulin-like growth factor-i-stimulated l-proline uptake was inhibited by one of its binding protein , insulin-like growth factor binding protein-4 , in a concentration-dependent manner.
CbG
Sucrose
AR
0.996
0.789
37
the amount ( maximal binding capacity of 24 to 30 fmol/mg protein ) and hormone binding affinity ( half-maximal saturation of 0.2 nm ) of the androgen receptor in cultured skin fibroblasts was normal , but the receptor was qualitatively abnormal as evidenced by instability on sucrose density gradient centrifugation.
CbG
D-Lysine
PLG
1.000
0.787
403
in both elisa and rocket immunoelectrophoresis systems , complex formation was inhibited by 10 mm epsilon-amino-n-caproic acid , implying that there is a role for the lysine binding sites of plg in mediating the interaction.
CbG
Adenosine
INSR
1.000
0.785
129
these findings demonstrate basal state binding of atp to the ckd leading to cis-autophosphorylation and novel basal state regulatory interactions among the subdomains of the insulin receptor kinase.
CbG
Adenosine
PLK1
1.000
0.783
104
most kinase inhibitors interact with the atp binding site on plk1 , which is highly conserved.
CbG
Calcium Chloride
ITPR3
0.995
0.777
1954
control of ca2 + influx in human neutrophils by inositol 1,4,5-trisphosphate ( ip3 ) binding : differential effects of micro-injected ip3 receptor antagonists.
CbG
D-Arginine
C5AR1
1.000
0.775
808
thus , selected out of a multiplicity of possibilities by the natural binding partner , arg37 as well as arg40 appear to be anchor residues in binding to the c5a receptor.
CbG
Ticagrelor
P2RY12
1.000
0.773
322
purpose : ticagrelor is a reversibly binding p2y12 receptor antagonist used clinically for the prevention of atherothrombotic events in patients with acute coronary syndromes ( acs ).
GiG
ABL1
ABL1
0.999
0.600
9572
the acquired resistance in patients who failed to respond to imatinib seemed to be induced by several point mutations in the bcr-abl gene , which were likely to affect the binding of imatinib with bcr-abl.
GiG
TP63
TP53
1.000
0.595
2557
tp63 , a member of the p53 gene family gene , encodes the np63 protein and is one of the most frequently amplified genes in squamous cell carcinomas ( scc ) of the head and neck ( hnscc ) and lungs ( lusc ).
GiG
FERMT1
FERMT1
0.004
0.590
194
ks is caused by mutations in the fermt1 gene encoding kindlin-1.
GiG
GRN
GRN
1.000
0.590
3842
background : mutations in the progranulin gene ( pgrn ) have recently been identified as a cause of frontotemporal lobar degeneration with ubiquitin-positive inclusions ( ftld-u ) in some families.
GiG
FASN
EP300
0.999
0.589
6
here , we demonstrated that p300 binds to and increases histone h3 lysine 27 acetylation ( h3k27ac ) in the fasn gene promoter.
GiG
SETBP1
SETBP1
1.000
0.588
354
the critical deleted region contains setbp1 gene ( set binding protein 1 ).
GiG
BCL2
BAK1
0.118
0.587
1220
different expression patterns of bcl-2 family genes in breast cancer by estrogen receptor status with special reference to pro-apoptotic bak gene.
GiG
SP1
INSR
0.948
0.587
23
thus , the efficient expression of the human insulin receptor gene possibly requires the binding of transcriptional factor sp1 to four g-c boxes located -593 to -618 base pairs upstream of the atg translation initiation codon.
GiG
ABCD1
ABCD1
1.000
0.586
410
x-linked adrenoleukodystrophy ( x-ald ) is caused by mutations in the abcd1 gene encoding the peroxisomal abc transporter adrenoleukodystrophy protein ( aldp ).
GiG
CYP1A1
AHR
0.996
0.586
1940
the liganded ah receptor activates transcription by binding to a specific dna-recognition motif within a dioxin-responsive enhancer upstream of the cyp1a1 gene.
 0000-0003-0002-5761 ·
  danich1
 dhimmel
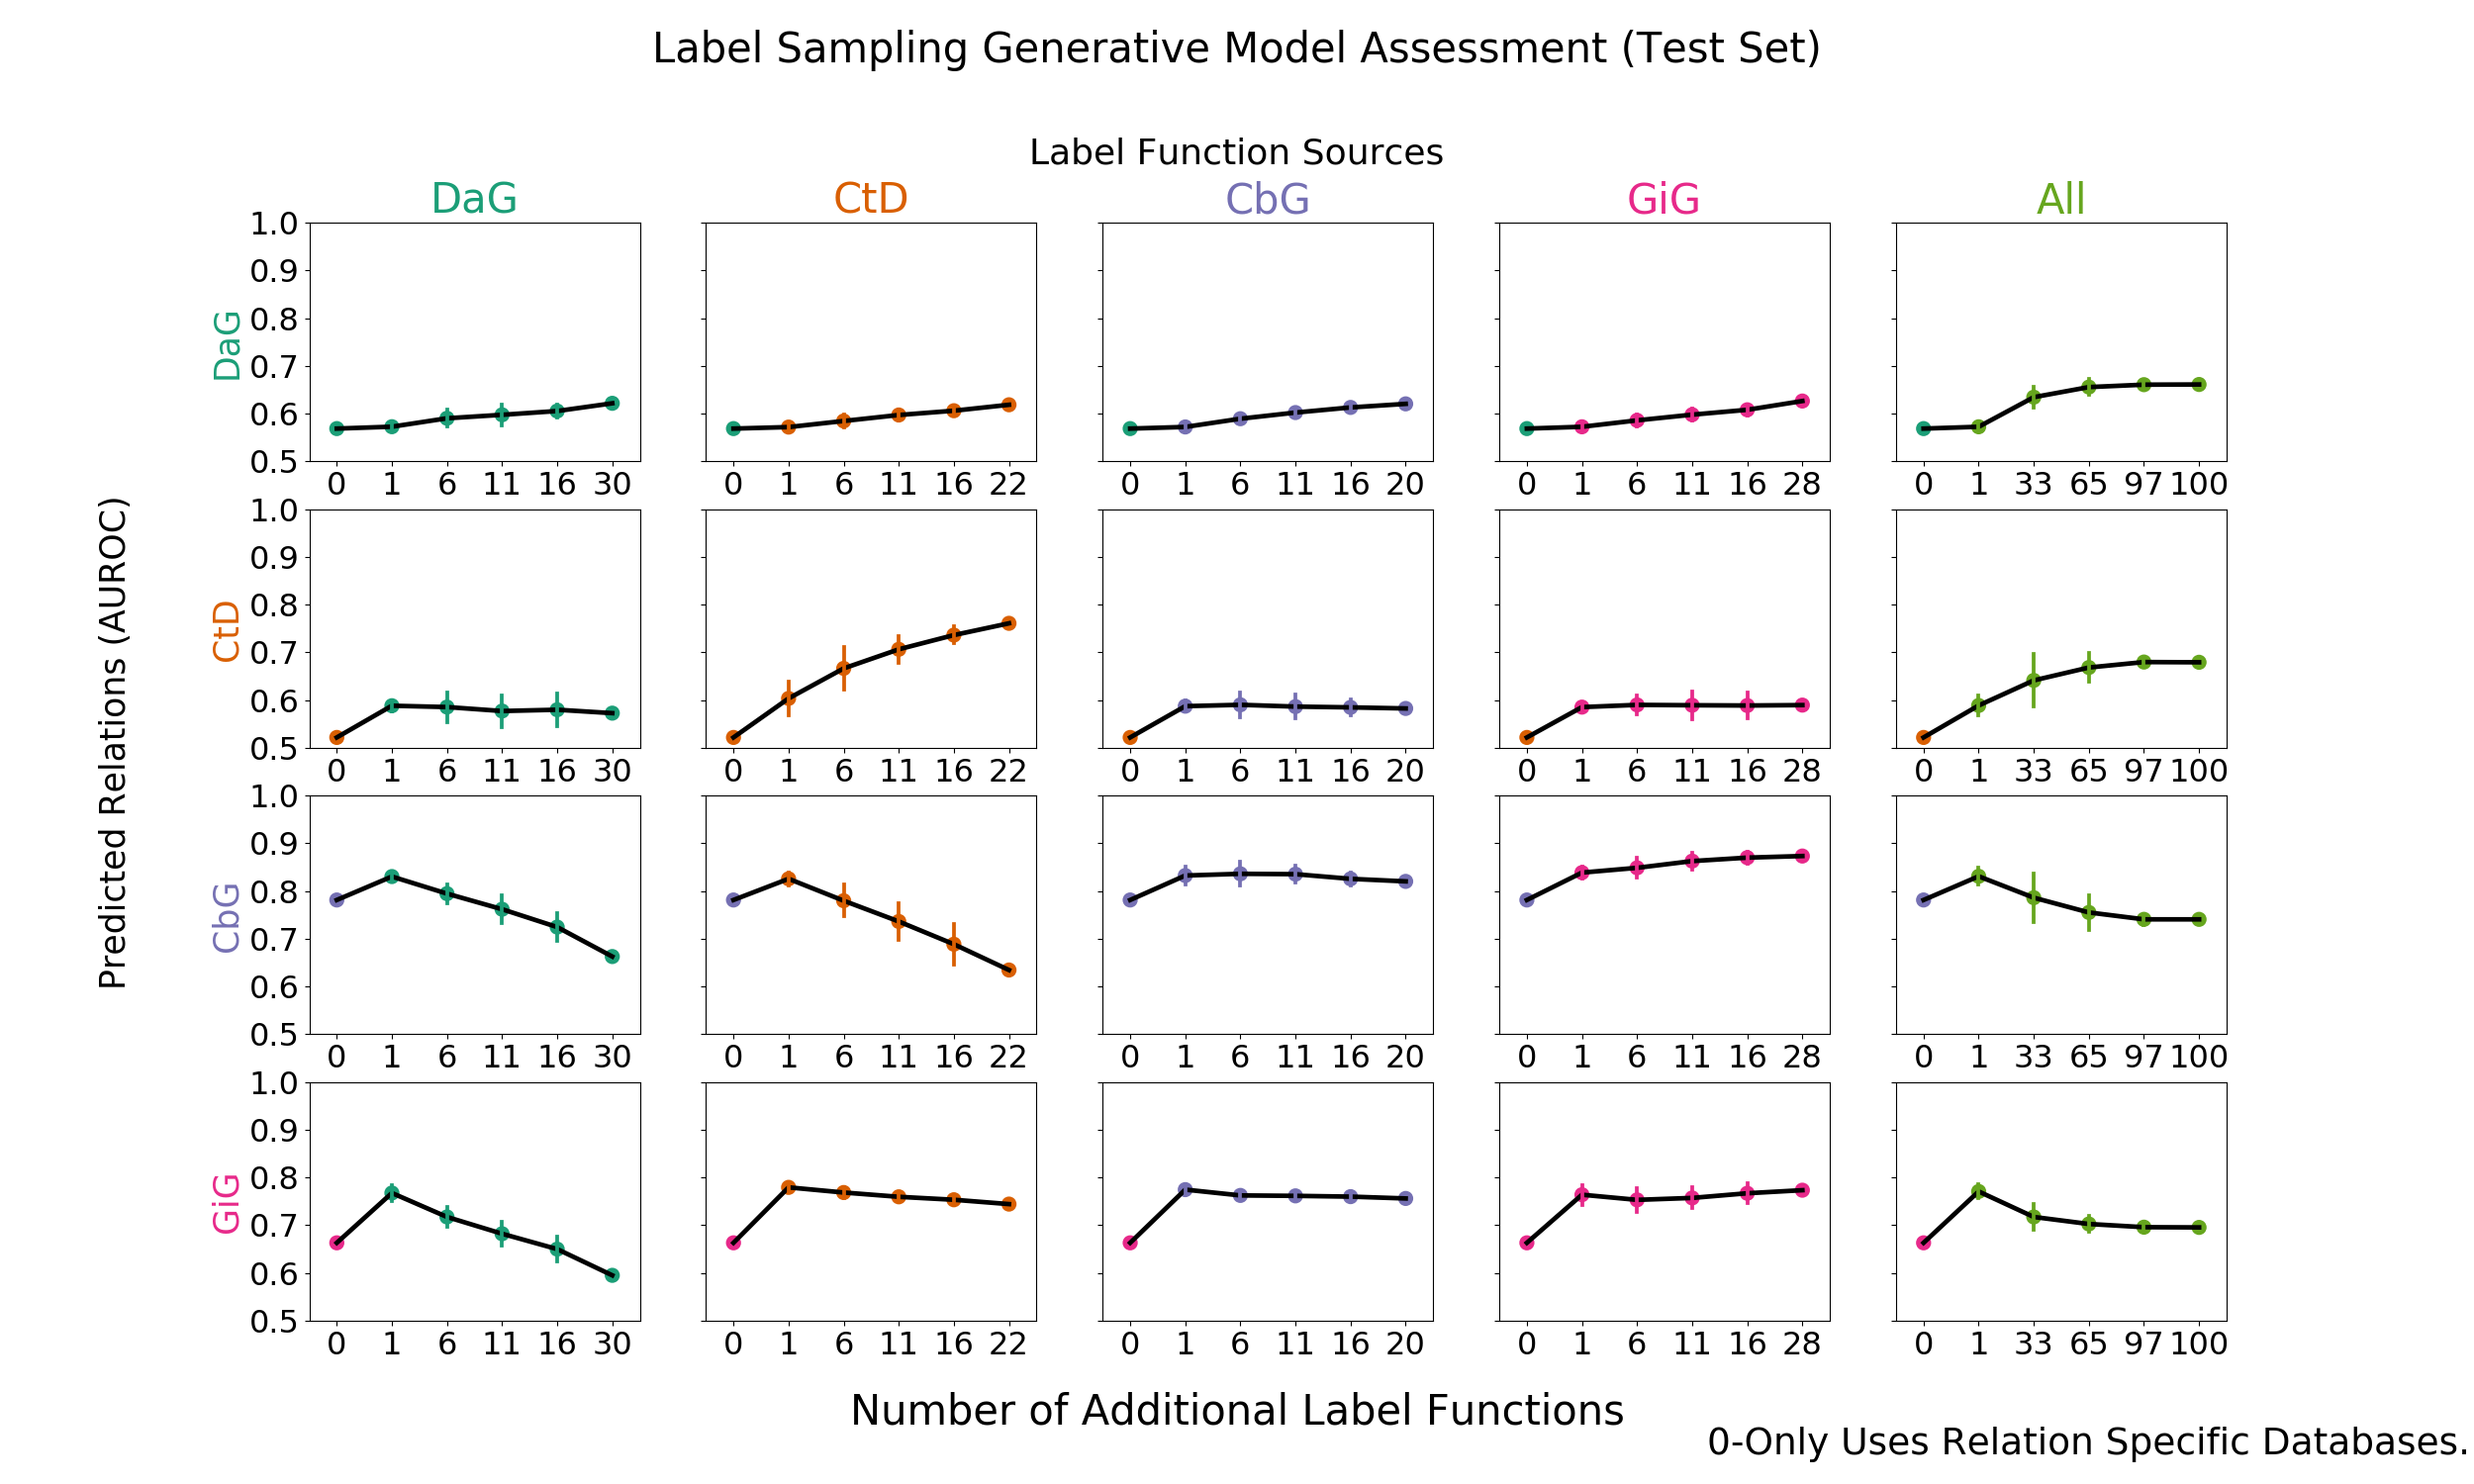
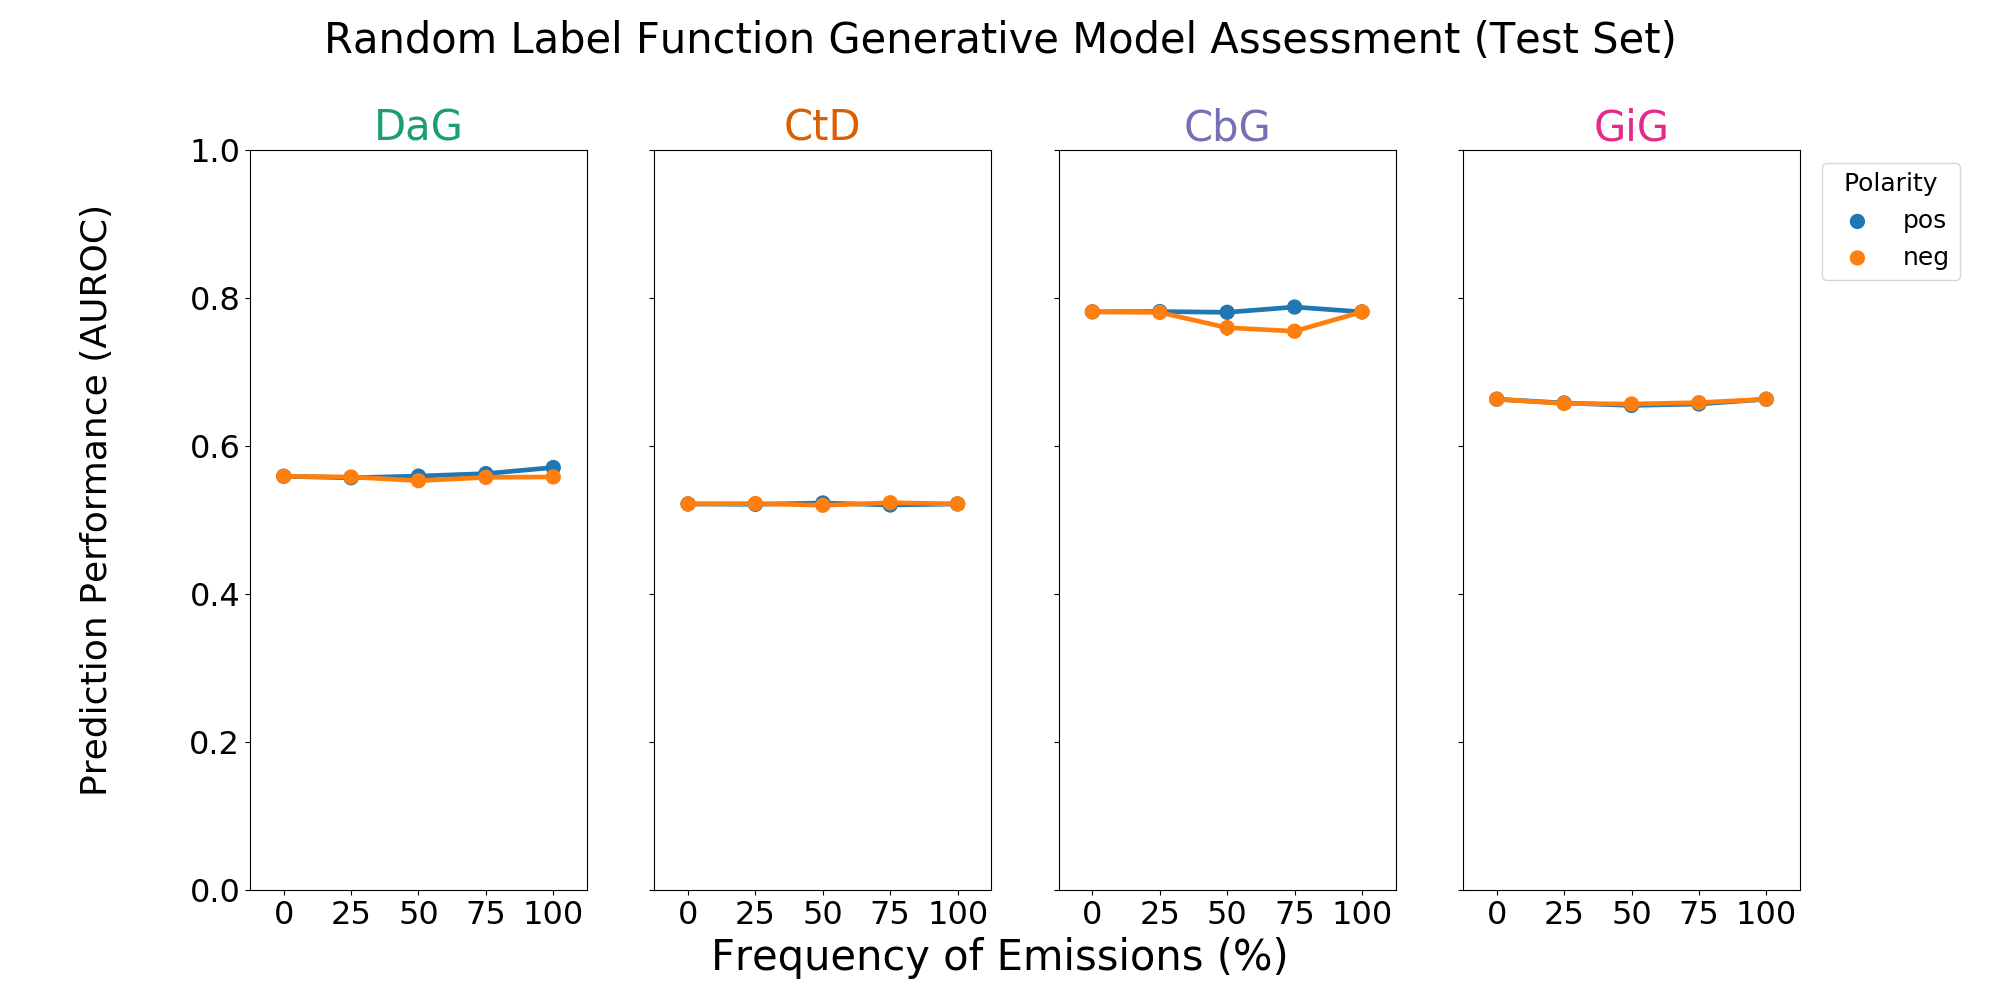
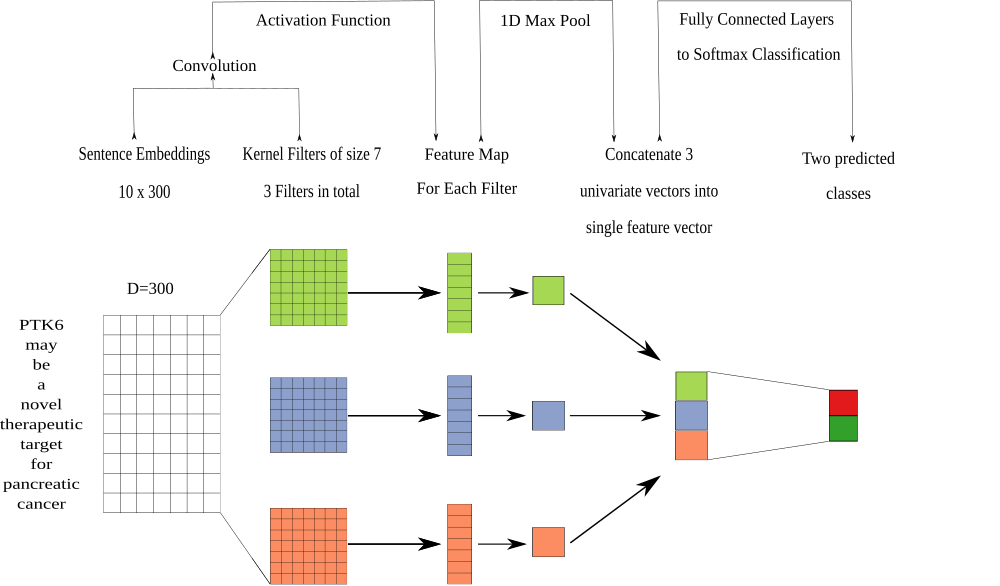
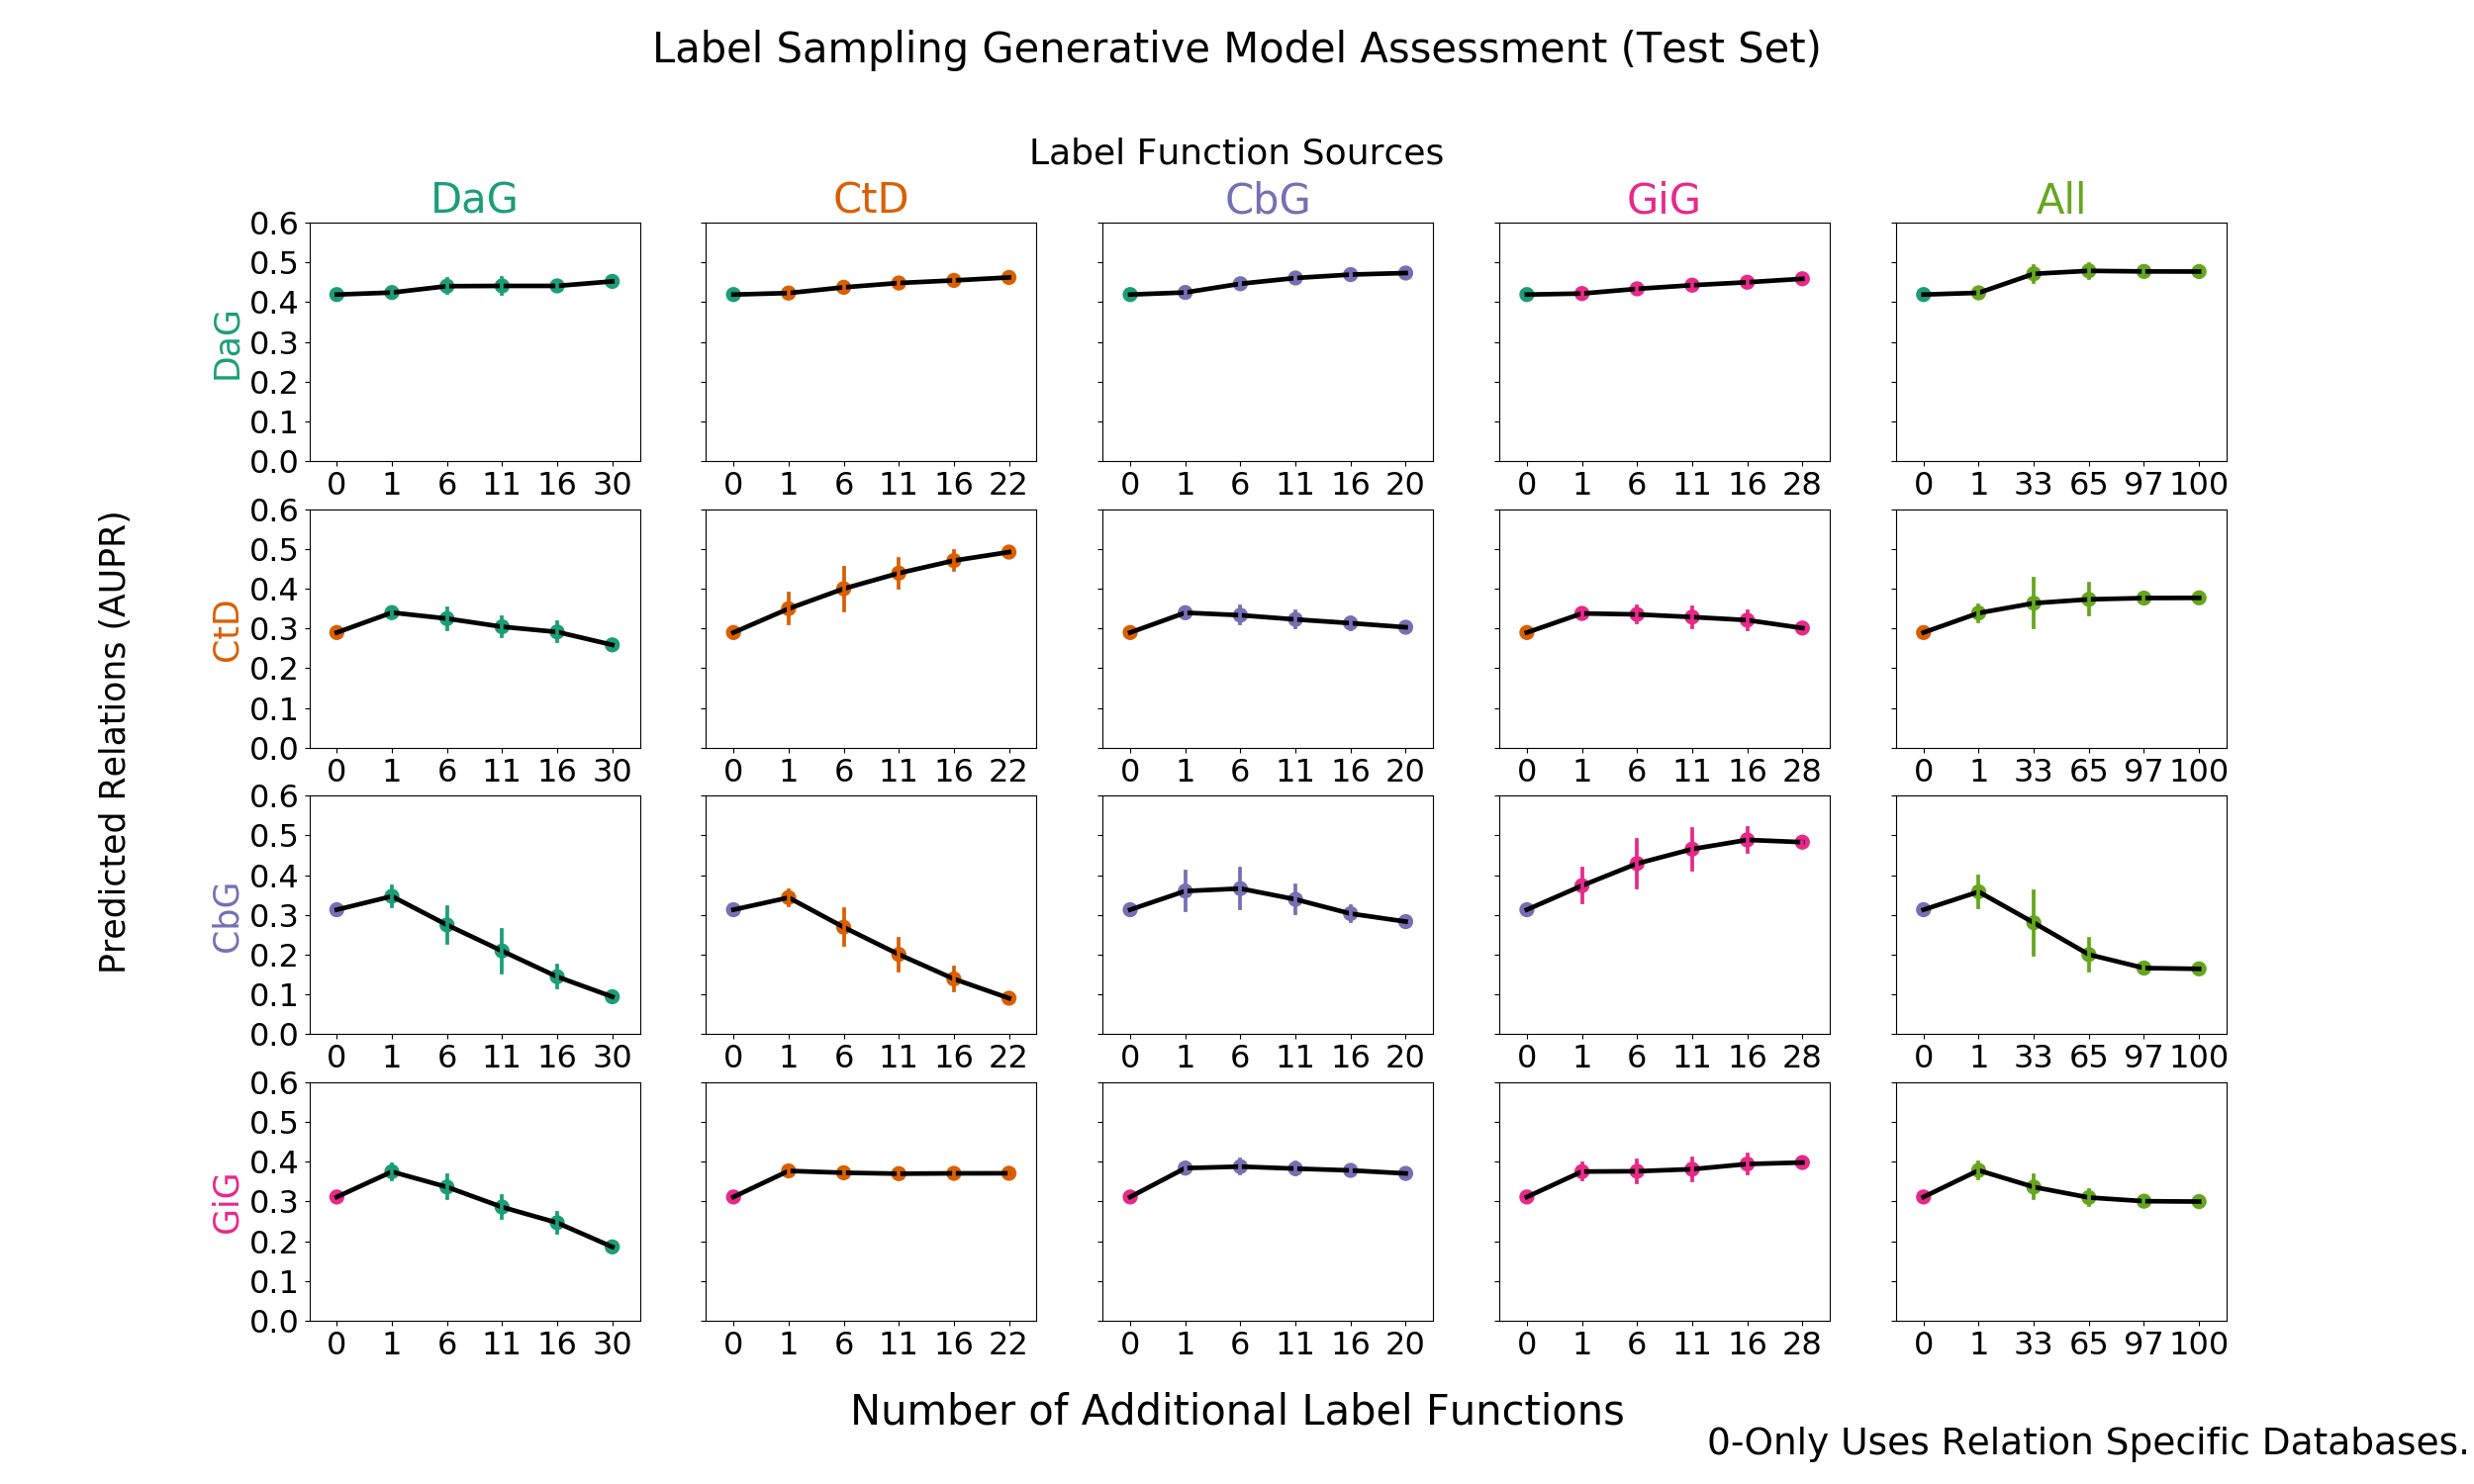
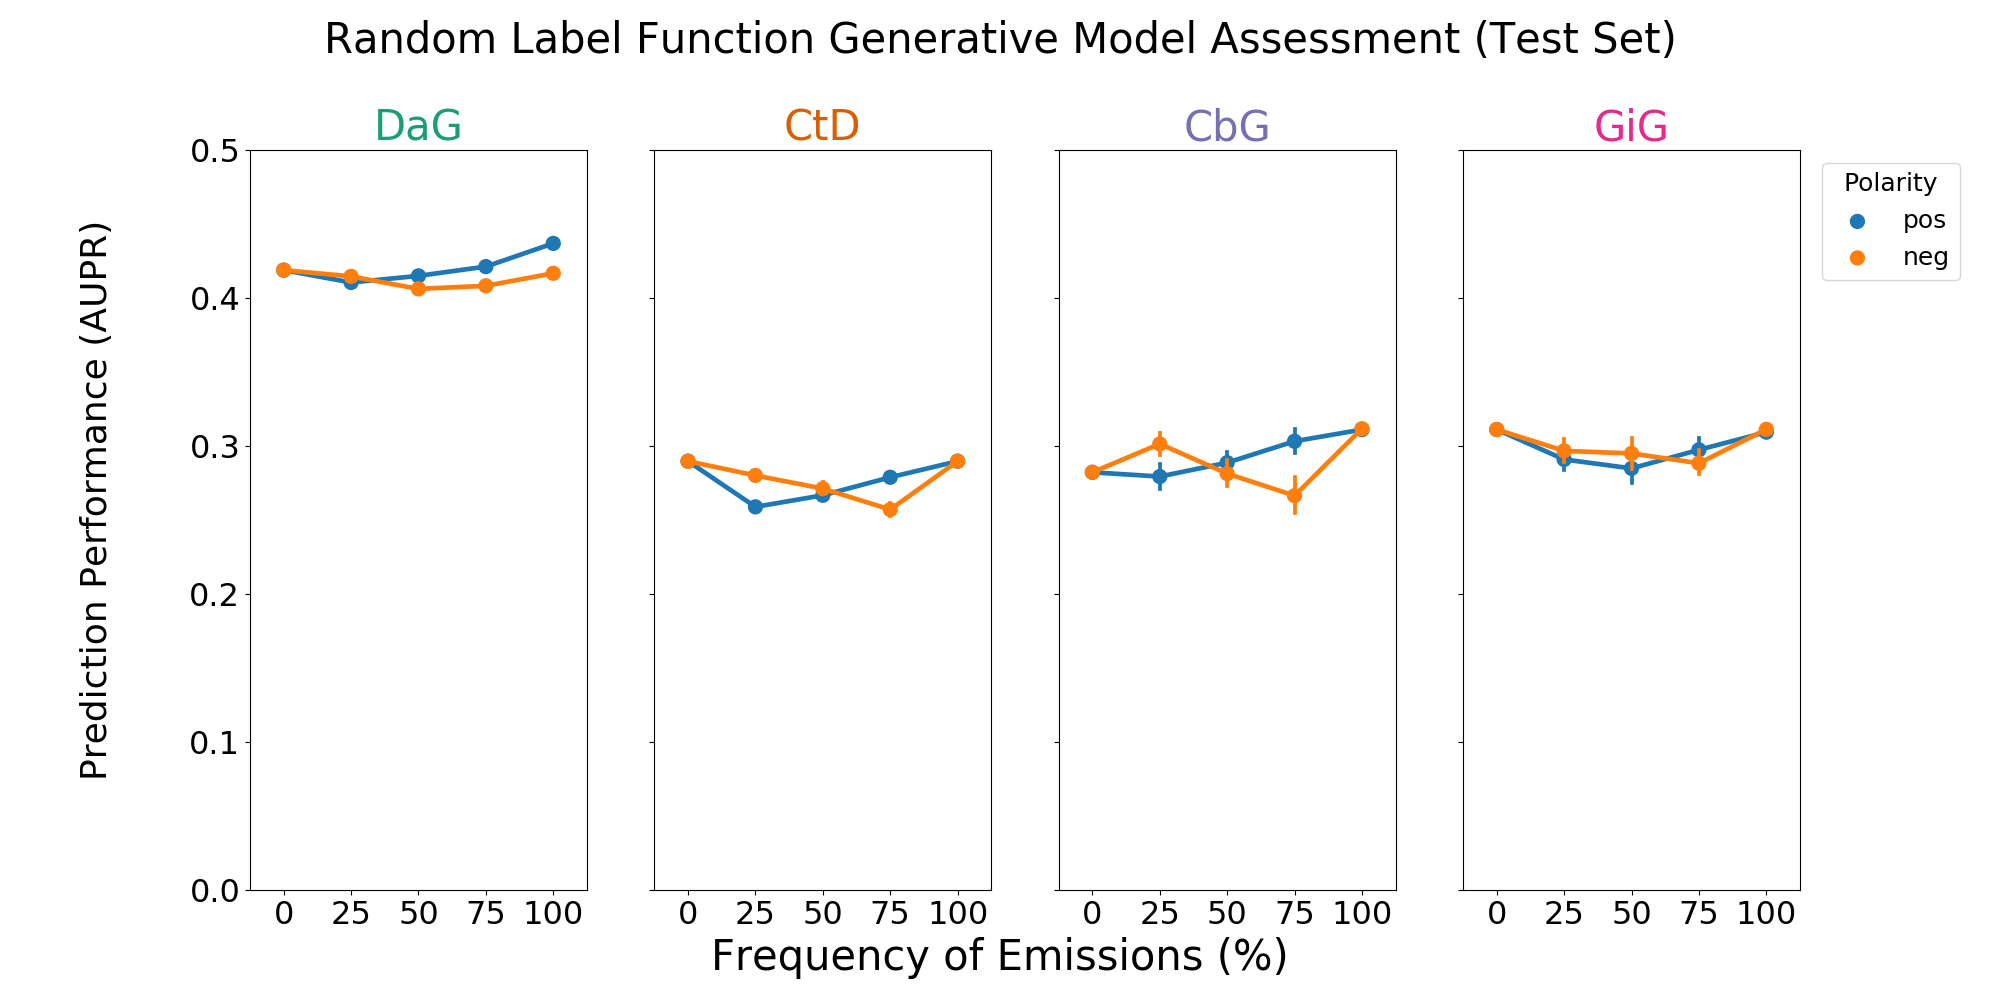
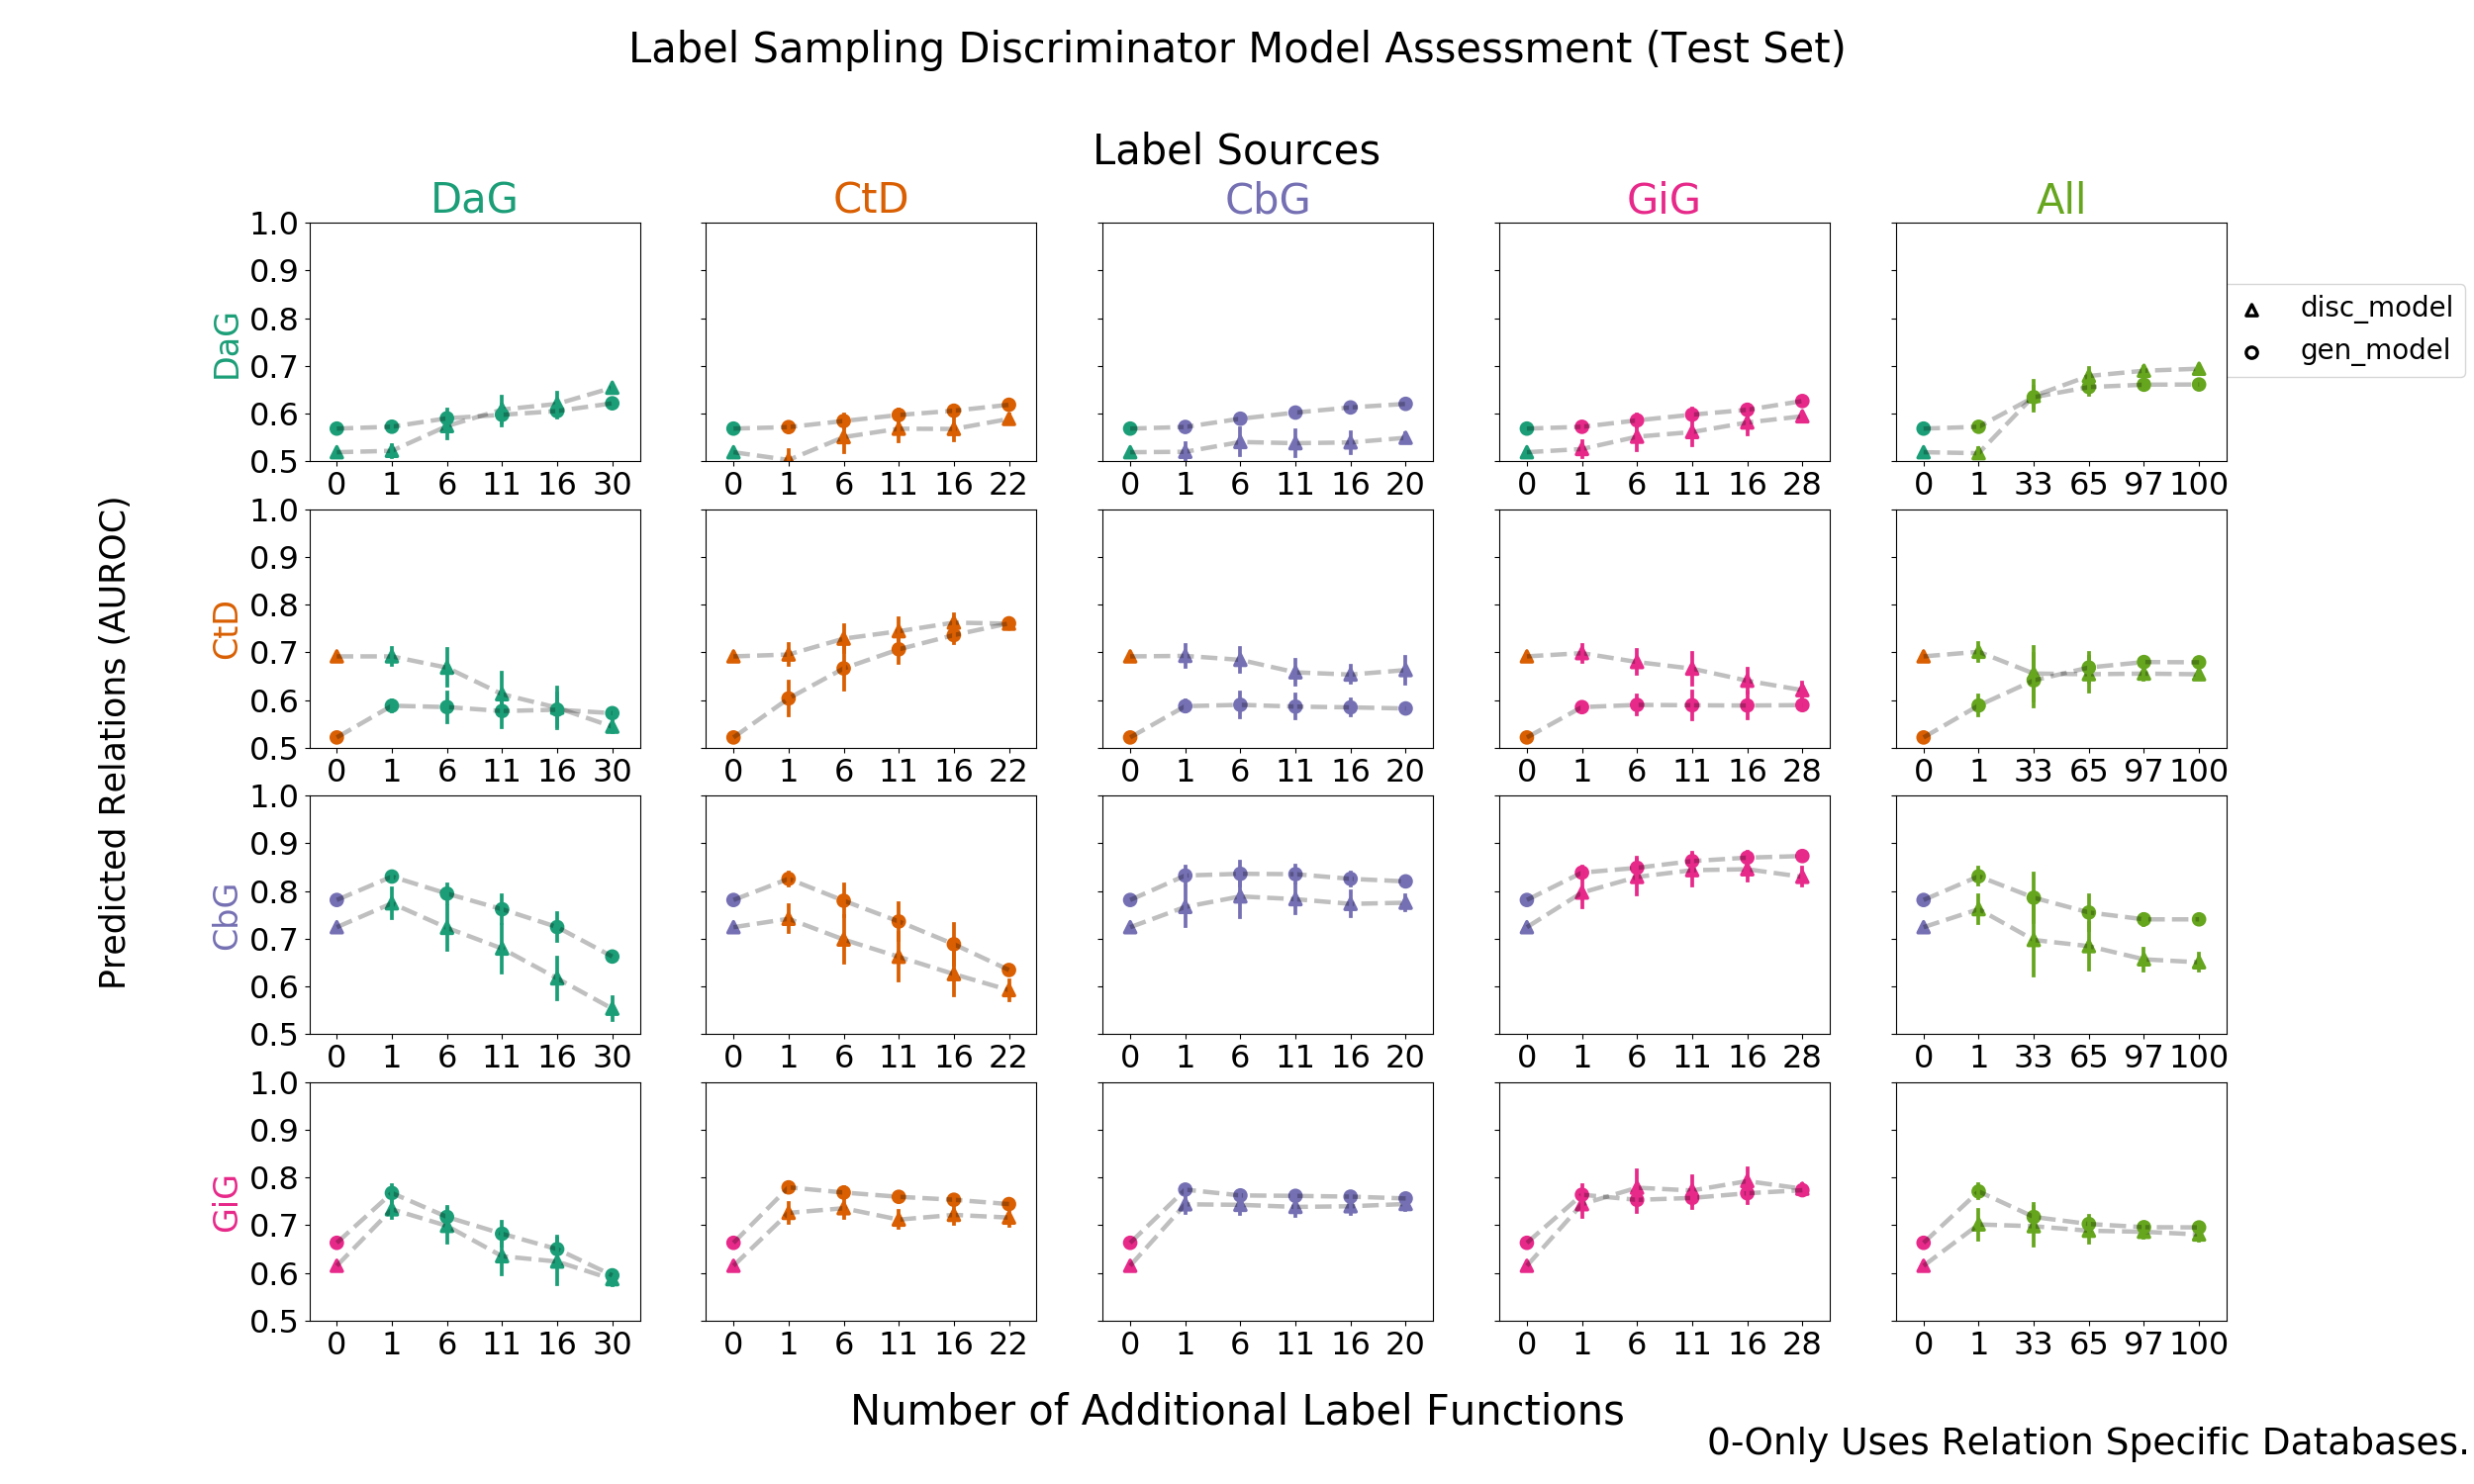
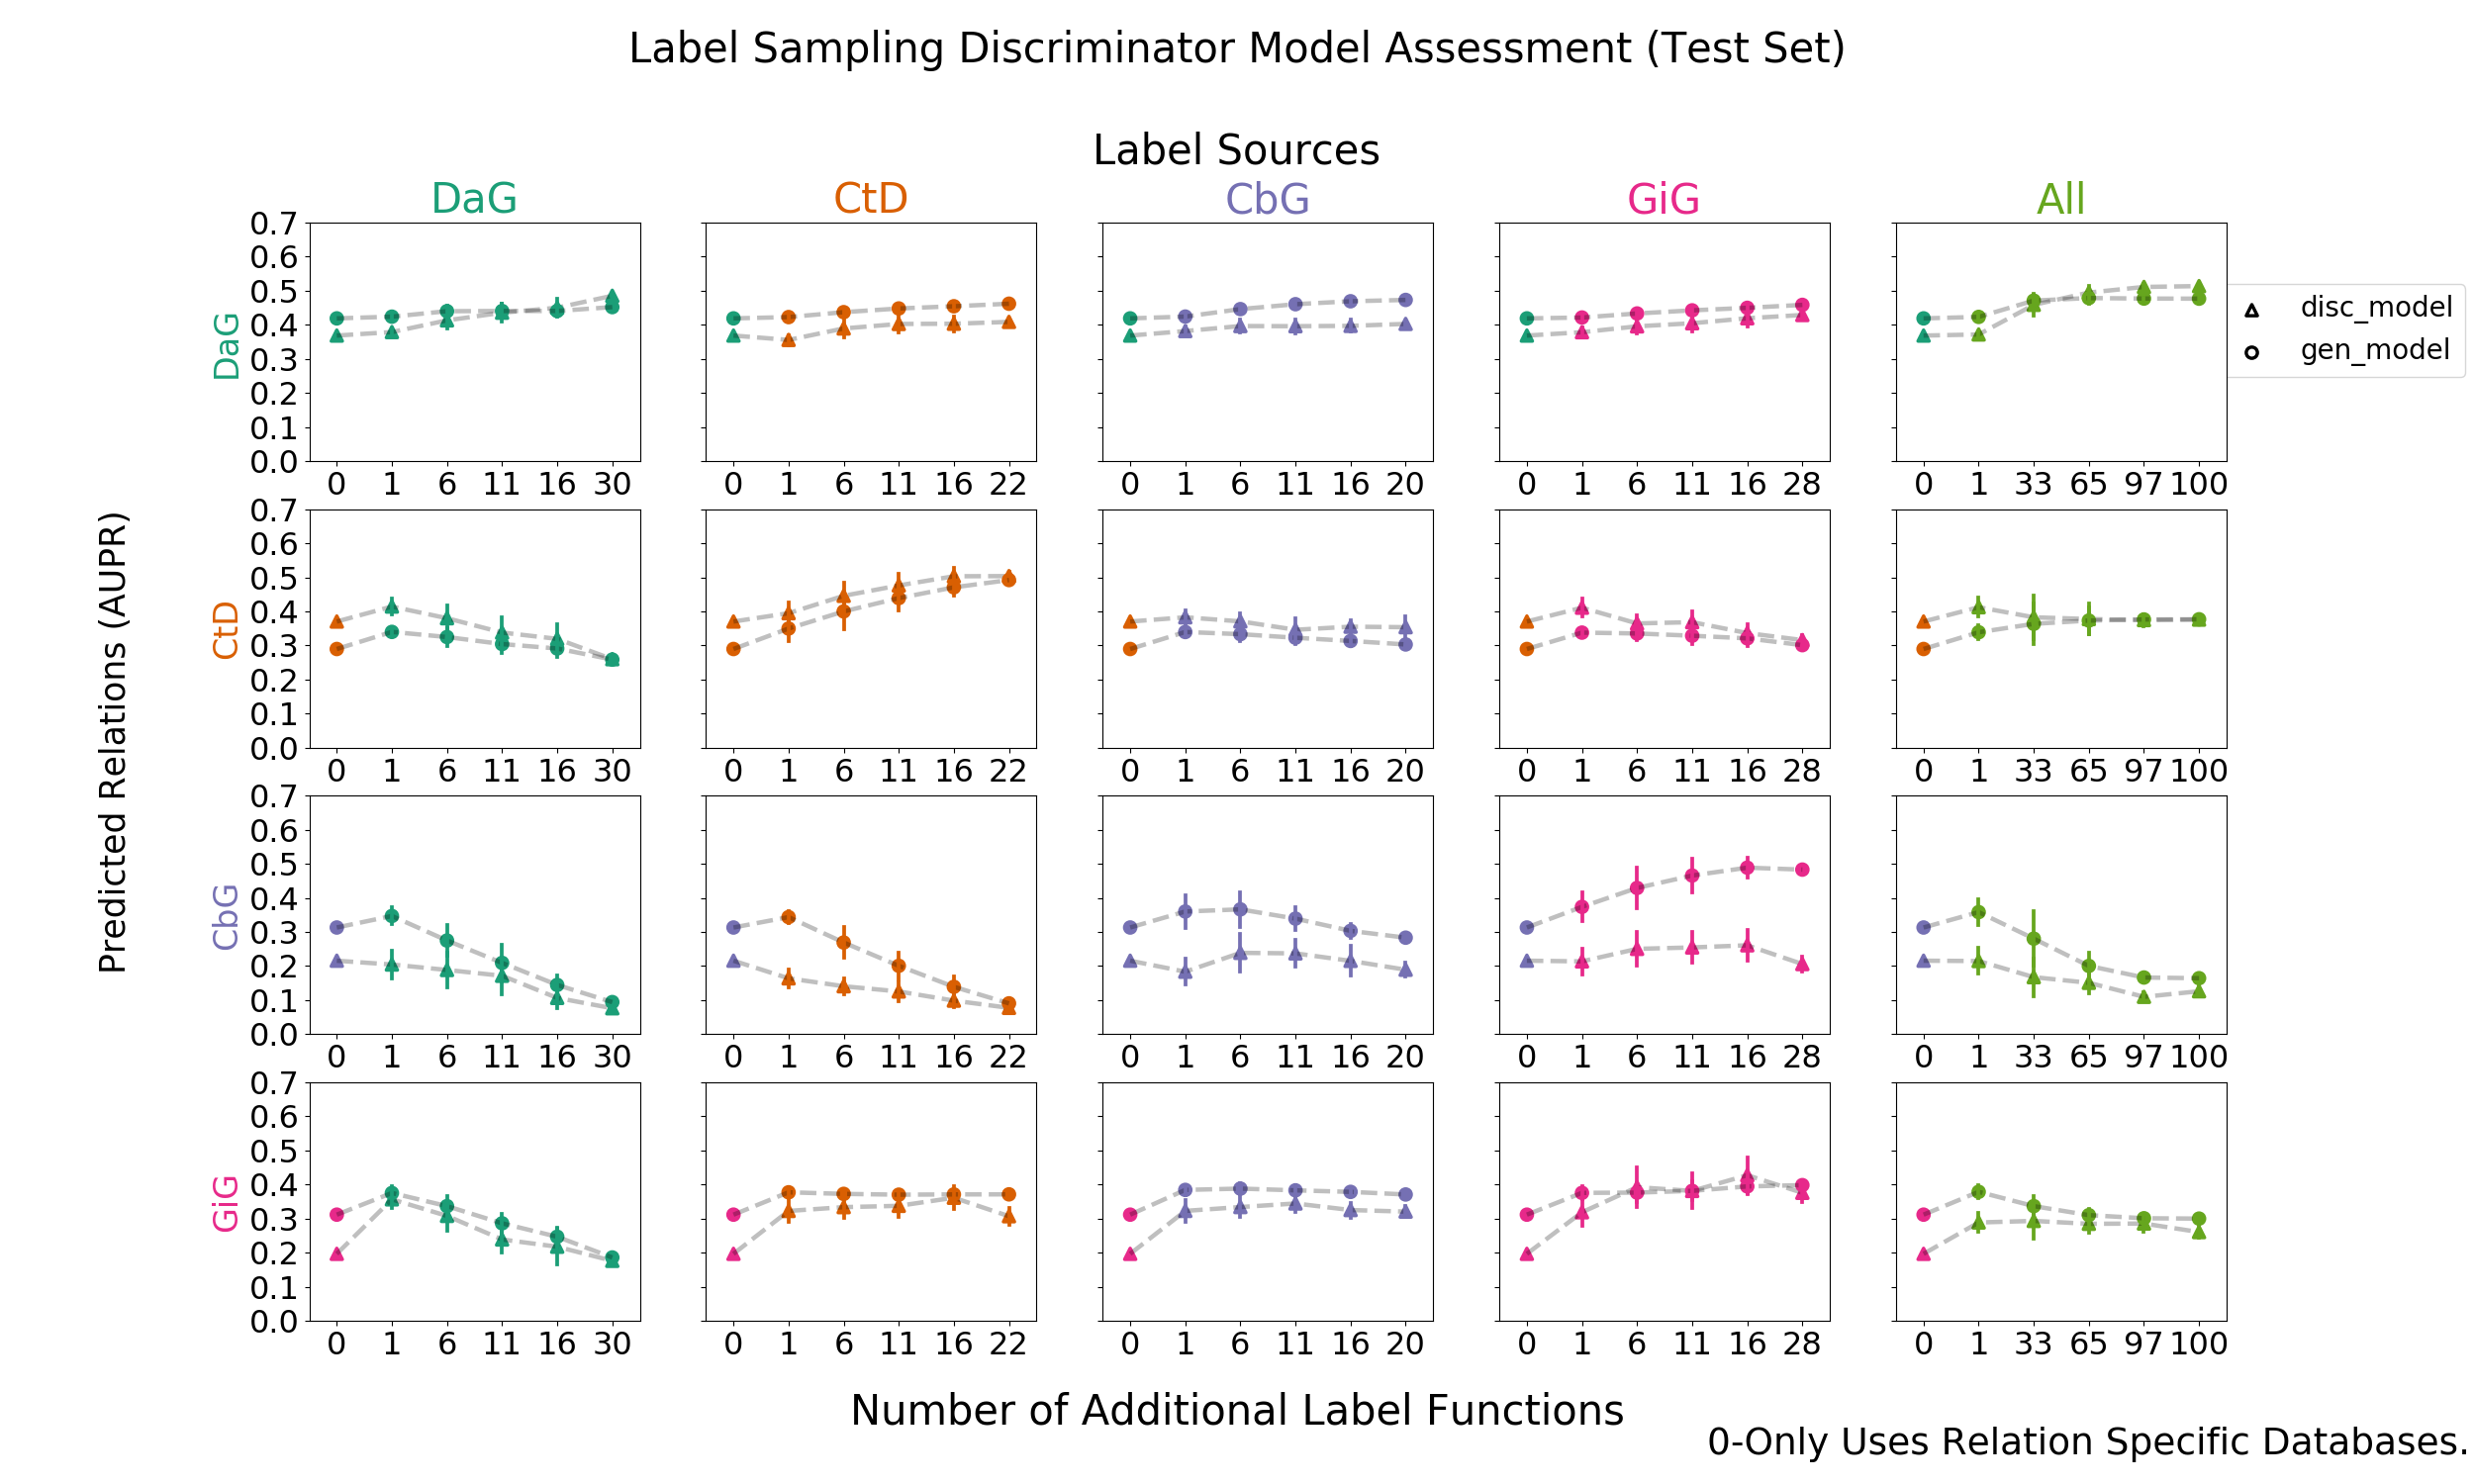
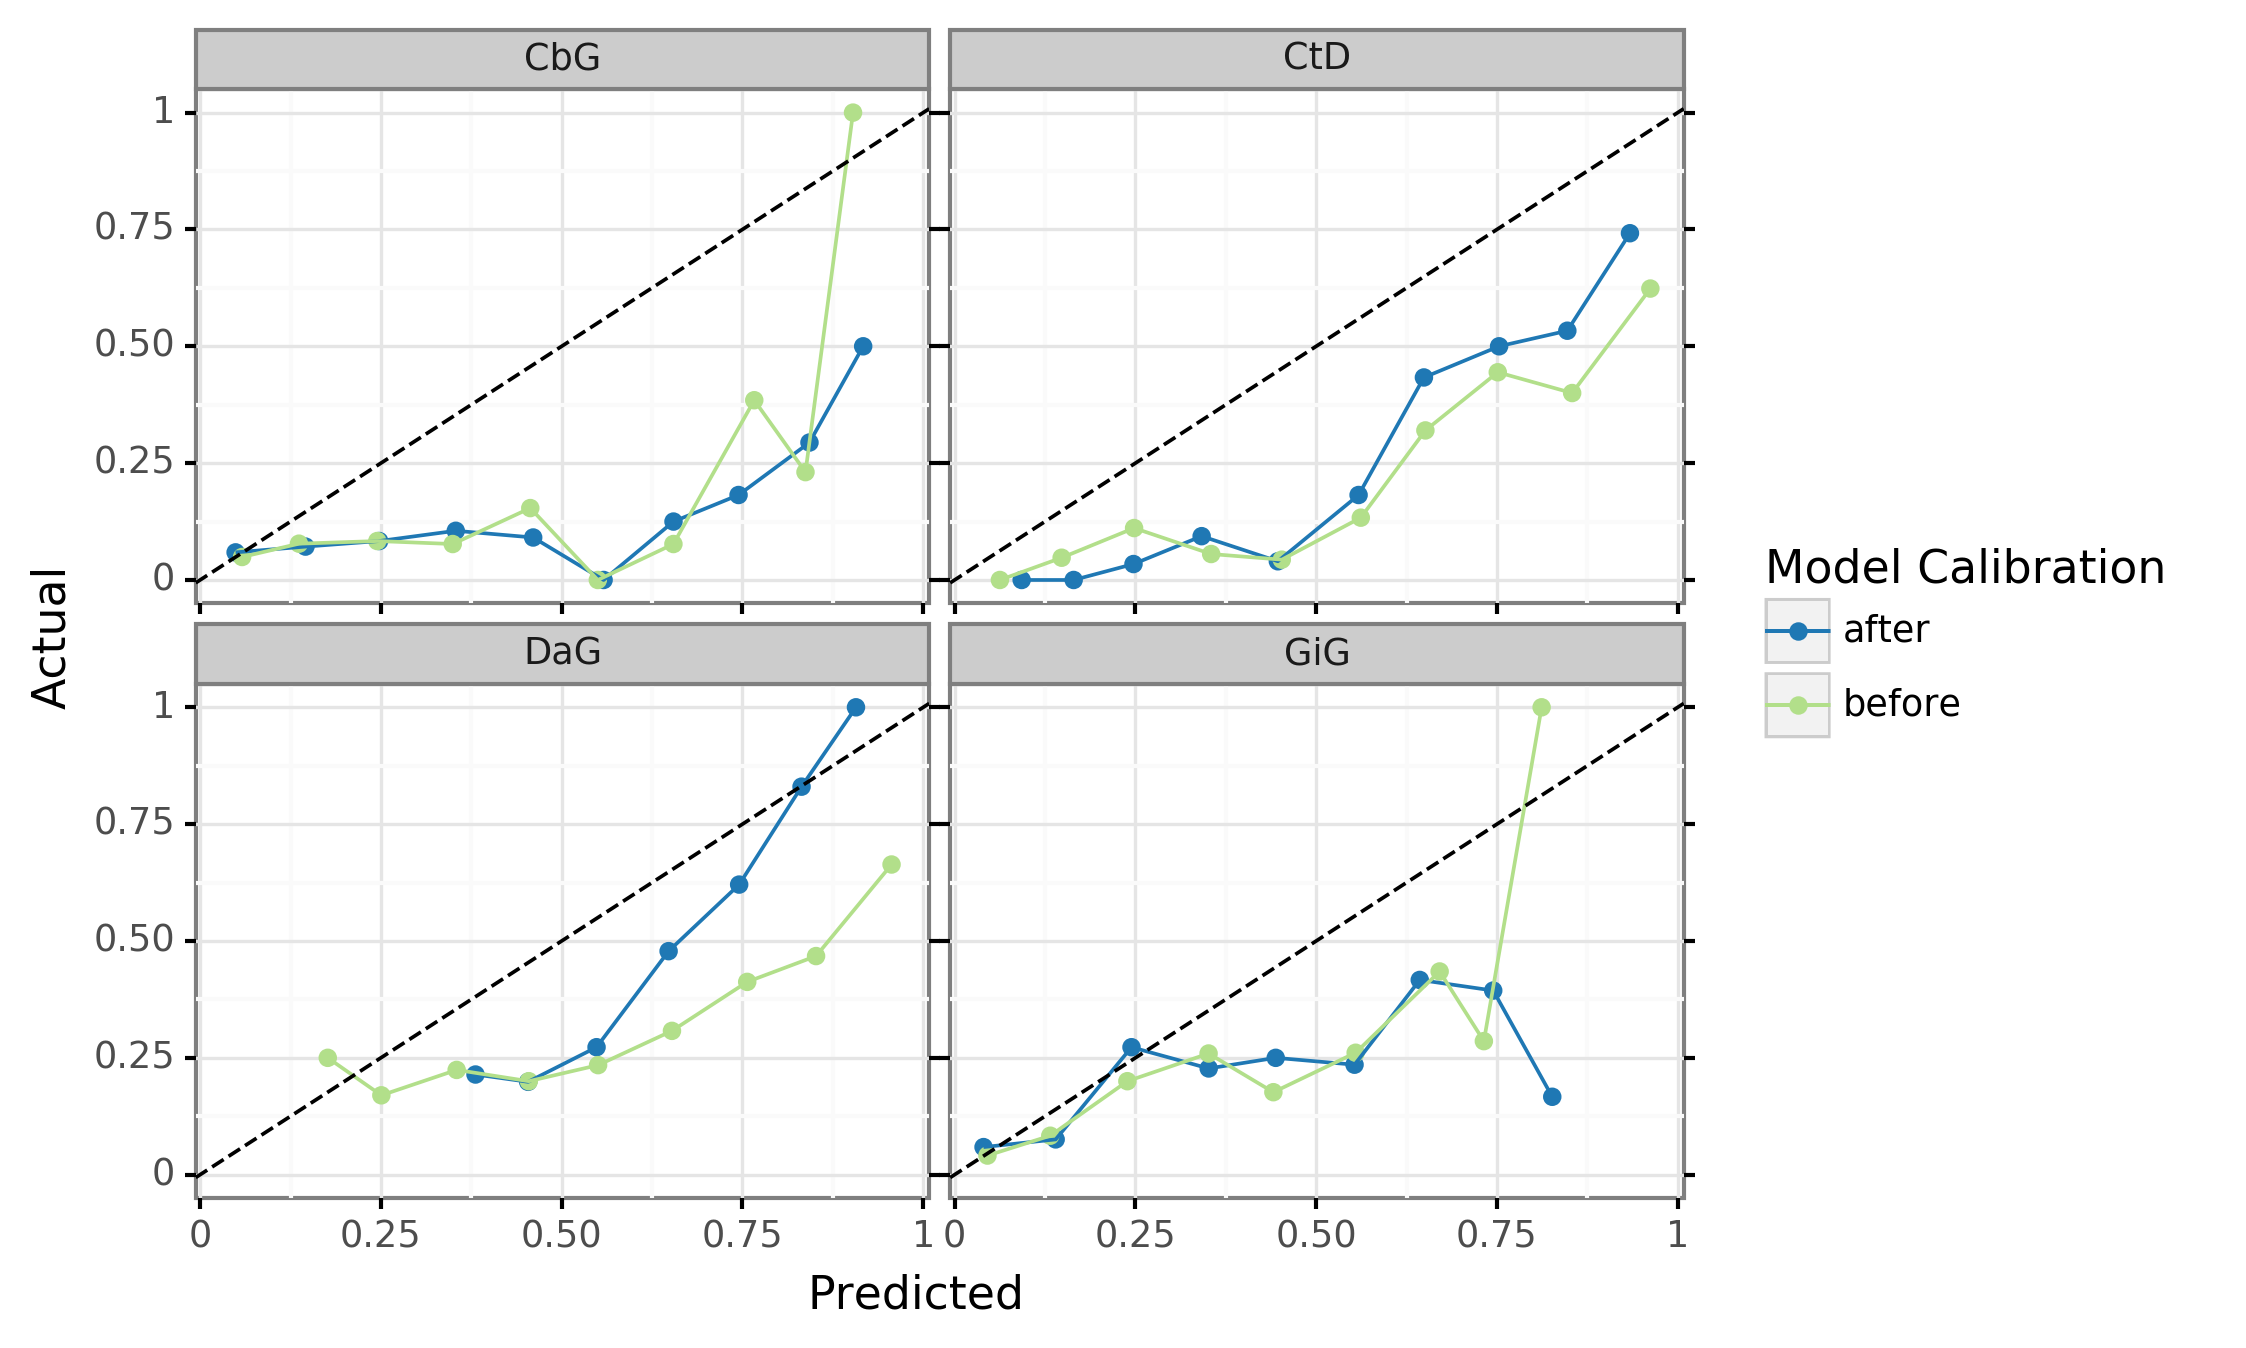
![Figure 10: Comparion between our model and CoCoScore model [13]. We report both model’s performance in terms of AUROC and AUPR. Our model achieves comparable performance against CoCoScore in terms of AUROC. As for AUPR, CoCoScore consistently outperforms our model except for CtD.](https://raw.githubusercontent.com/danich1/snorkeling/0149086785b19f9429c92565d650e9d049c136ff/figures/literature_models/model_comparison.png)