Qiwen Hu None · huqiwen0313 · qiwen_hu Department of Systems Pharmacology and Translational Therapeutics, Perelman School of Medicine, University of Pennsylvania
Casey S. Greene 0000-0001-8713-9213 · cgreene · greenescientist Department of Systems Pharmacology and Translational Therapeutics, Perelman School of Medicine, University of Pennsylvania; Childhood Cancer Data Lab, Alex’s Lemonade Stand Foundation · Funded by Grant TBD
Abstract
We wrote an application for the Chan Zuckerberg Initiative’s Collaborative Computational Tools RFA. Our application was recommended for funding. We are writing our progress report as we go. This repository contains the report. Please feel free to file a GitHub Issue to ask a question. Some elements of this report are expected to also be written up via a published manuscript. In the event that we write a manuscript, we will begin from this report. Authorship will be determined in accordance with ICMJE guidelines.
Introduction
Currently this contains text describing our project from our initial proposal.
The Human Cell Atlas (HCA) aims to provide a comprehensive map of all types of human cells. Connecting that map to disease states, which will be key to the CZI’s mission of curing or managing all diseases in the next eighty years, will require us to see how these cell types change during aging, during disease processes, or in the presence of drugs. Ideally, we’d be able to apply a transformation to the HCA’s reference map to predict and study these states.
Certain types of deep neural networks can generate hypothetical data by learning and decoding a lower dimensional latent space. An ideal latent space enables arithmetic operations that use data to produce realistic output for novel transformations. For example, FaceApp [1] can modify a picture of an individual to produce an image of the subject at an older age, with a different expression, or of a different gender.
The overall objective of this proposal is to determine how unsupervised deep neural network models can best be trained on single cell expression data from the HCA and the extent to which such models define biological latent spaces that capture disease states and targeted perturbations. The rationale is that latent space arithmetic for single cell transcriptomes would enable researchers to use predict how the expression of every gene would change in each HCA-identified cell type in numerous conditions including after drug treatment, in the context of a specific genetic variant, with a specific disease, or a combination of these and other factors.
Summary
Certain deep neural networks can generate hypothetical data by learning and decoding a lower dimensional latent space. This latent space enables arithmetic operations that produce realistic output for novel transformations. This allows users to generate hypothetical images [2] and to interpolate protein localizations through the cell-cycle [3]. An accessible example of latent space transformations comes from FaceApp [1], which modifies a picture of an individual to produce an image of the subject at an older age, with a different expression, or of a different genders.
Our overall objective is to determine how unsupervised deep neural network models can best be trained on single cell expression data from the Human Cell Atlas (HCA) and the extent to which such models define biological latent spaces that capture disease states and targeted perturbations. The rationale is that latent space arithmetic for genomic data would enable researchers to predict how the expression of every gene would change in each HCA-identified cell type after drug treatment, in the context of a specific genetic variant, with a specific disease, or a combination of these and other factors.
Prior Contributions / Preliminary Results
We previously developed neural-network based methods for unsupervised integration of transcriptomic data [4]. We now build to Generative Adversarial Networks (GANs) and Variational Autoencoders (VAEs) which have a track record of defining meaningful latent spaces for images. We adapted GANs to generate realistic individuals under a differential privacy framework [7] and built VAEs over bulk transcriptomic data with the goal of describing a biologically-relevant latent space [8]. Here, we will apply these unsupervised deep learning methods to single cell transcriptomic data and incorporate novel data augmentation approaches for genomics. We also bring workflow automation experience to the HCA community [9].
Aim 1: Develop proof-of-concept unsupervised deep learning methods for single cell transcriptomic data from the HCA.
Proposed work
The objective of this aim is to implement and test approaches to build deep generative models, such as VAEs [10] and GANs [11], from HCA single cell RNA-seq data.
Single cell data pose unique opportunities, but also challenges, for deep neural network algorithms. Many cells are often assayed, and many observations are needed to use deep learning effectively. However, transcript abundance estimates for each cell are generally subject to more error than bulk samples.
In our experience with generative deep learning [7] it can be difficult to predict optimal parameters in advance. We will perform a grid search over VAE architectures and hyperparameters to identify suitable options. We will evaluate zero-inflated loss among more traditional loss functions, as Chris Probert noted potential benefits on our proposal’s GitHub repository [12][13][14][15]]. This process will identify a subset of parameters and architectures that are worth exploring further for single cells.
We will also develop data augmentation for single cell RNA-seq data, as no such approaches exist yet for transcriptomes. To understand data augmentation, imagine scanned pathology slides. Each slide may be prepared and scanned with a subtly different orientation or magnification. A deep learning method may identify these measurement differences, or there may be too few slides to train a good model. Applying arbitrary rotations, zooms, and other irrelevant transformations increases the effective amount of training data and reduces the model’s propensity to learn such noise.
We plan to use fast abundance estimates for RNA-seq [16] to perform data augmentation for transcriptomes. Multiple resamples or subsamples of reads during transcript abundance estimation can capture uncertainty in the data, akin to arbitrary rotations. Therefore, we plan to collaborate with Rob Patro’s laboratory (Collaborative Network) to implement these and related approaches. We posit that genomic data augmentation will improve latent feature generalization by separating biological from technical features and increasing the effective sample size during training.
We will select high-quality models by choosing those that minimize both reconstruction loss and KL divergence [10]. We will evaluate resulting models for their applicability to rheumatic disease and their suitability for latent space arithmetic (see: Evaluation).
Results
VAE test on simulated single cell datasets
1. Simulation data generation:
Simulated single cell data was generated by splatter [18].
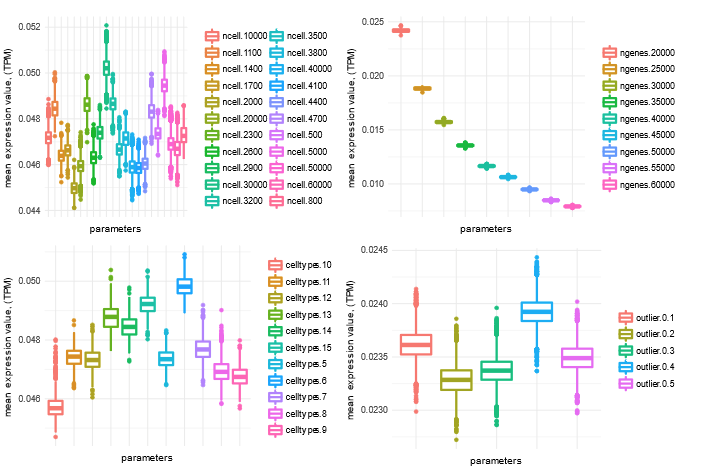
Parameters used: * nCells - The number of cells to simulate: 500 - 5000 * nGenes - The number of genes to simulate: 20000 - 60000 * nGroups - The number of cell types: 5 - 15 * outlier - probability of a gene that is an expression outlier: 0.1 - 0.5 * default parameter is ncells = 600, nGenes = 20000, cell types = 5, batchsize = 1
Simulation statistics under different parameters:
Figure 1: Distribution of mean expression level of simulated genes across samples under different simulated parameters.
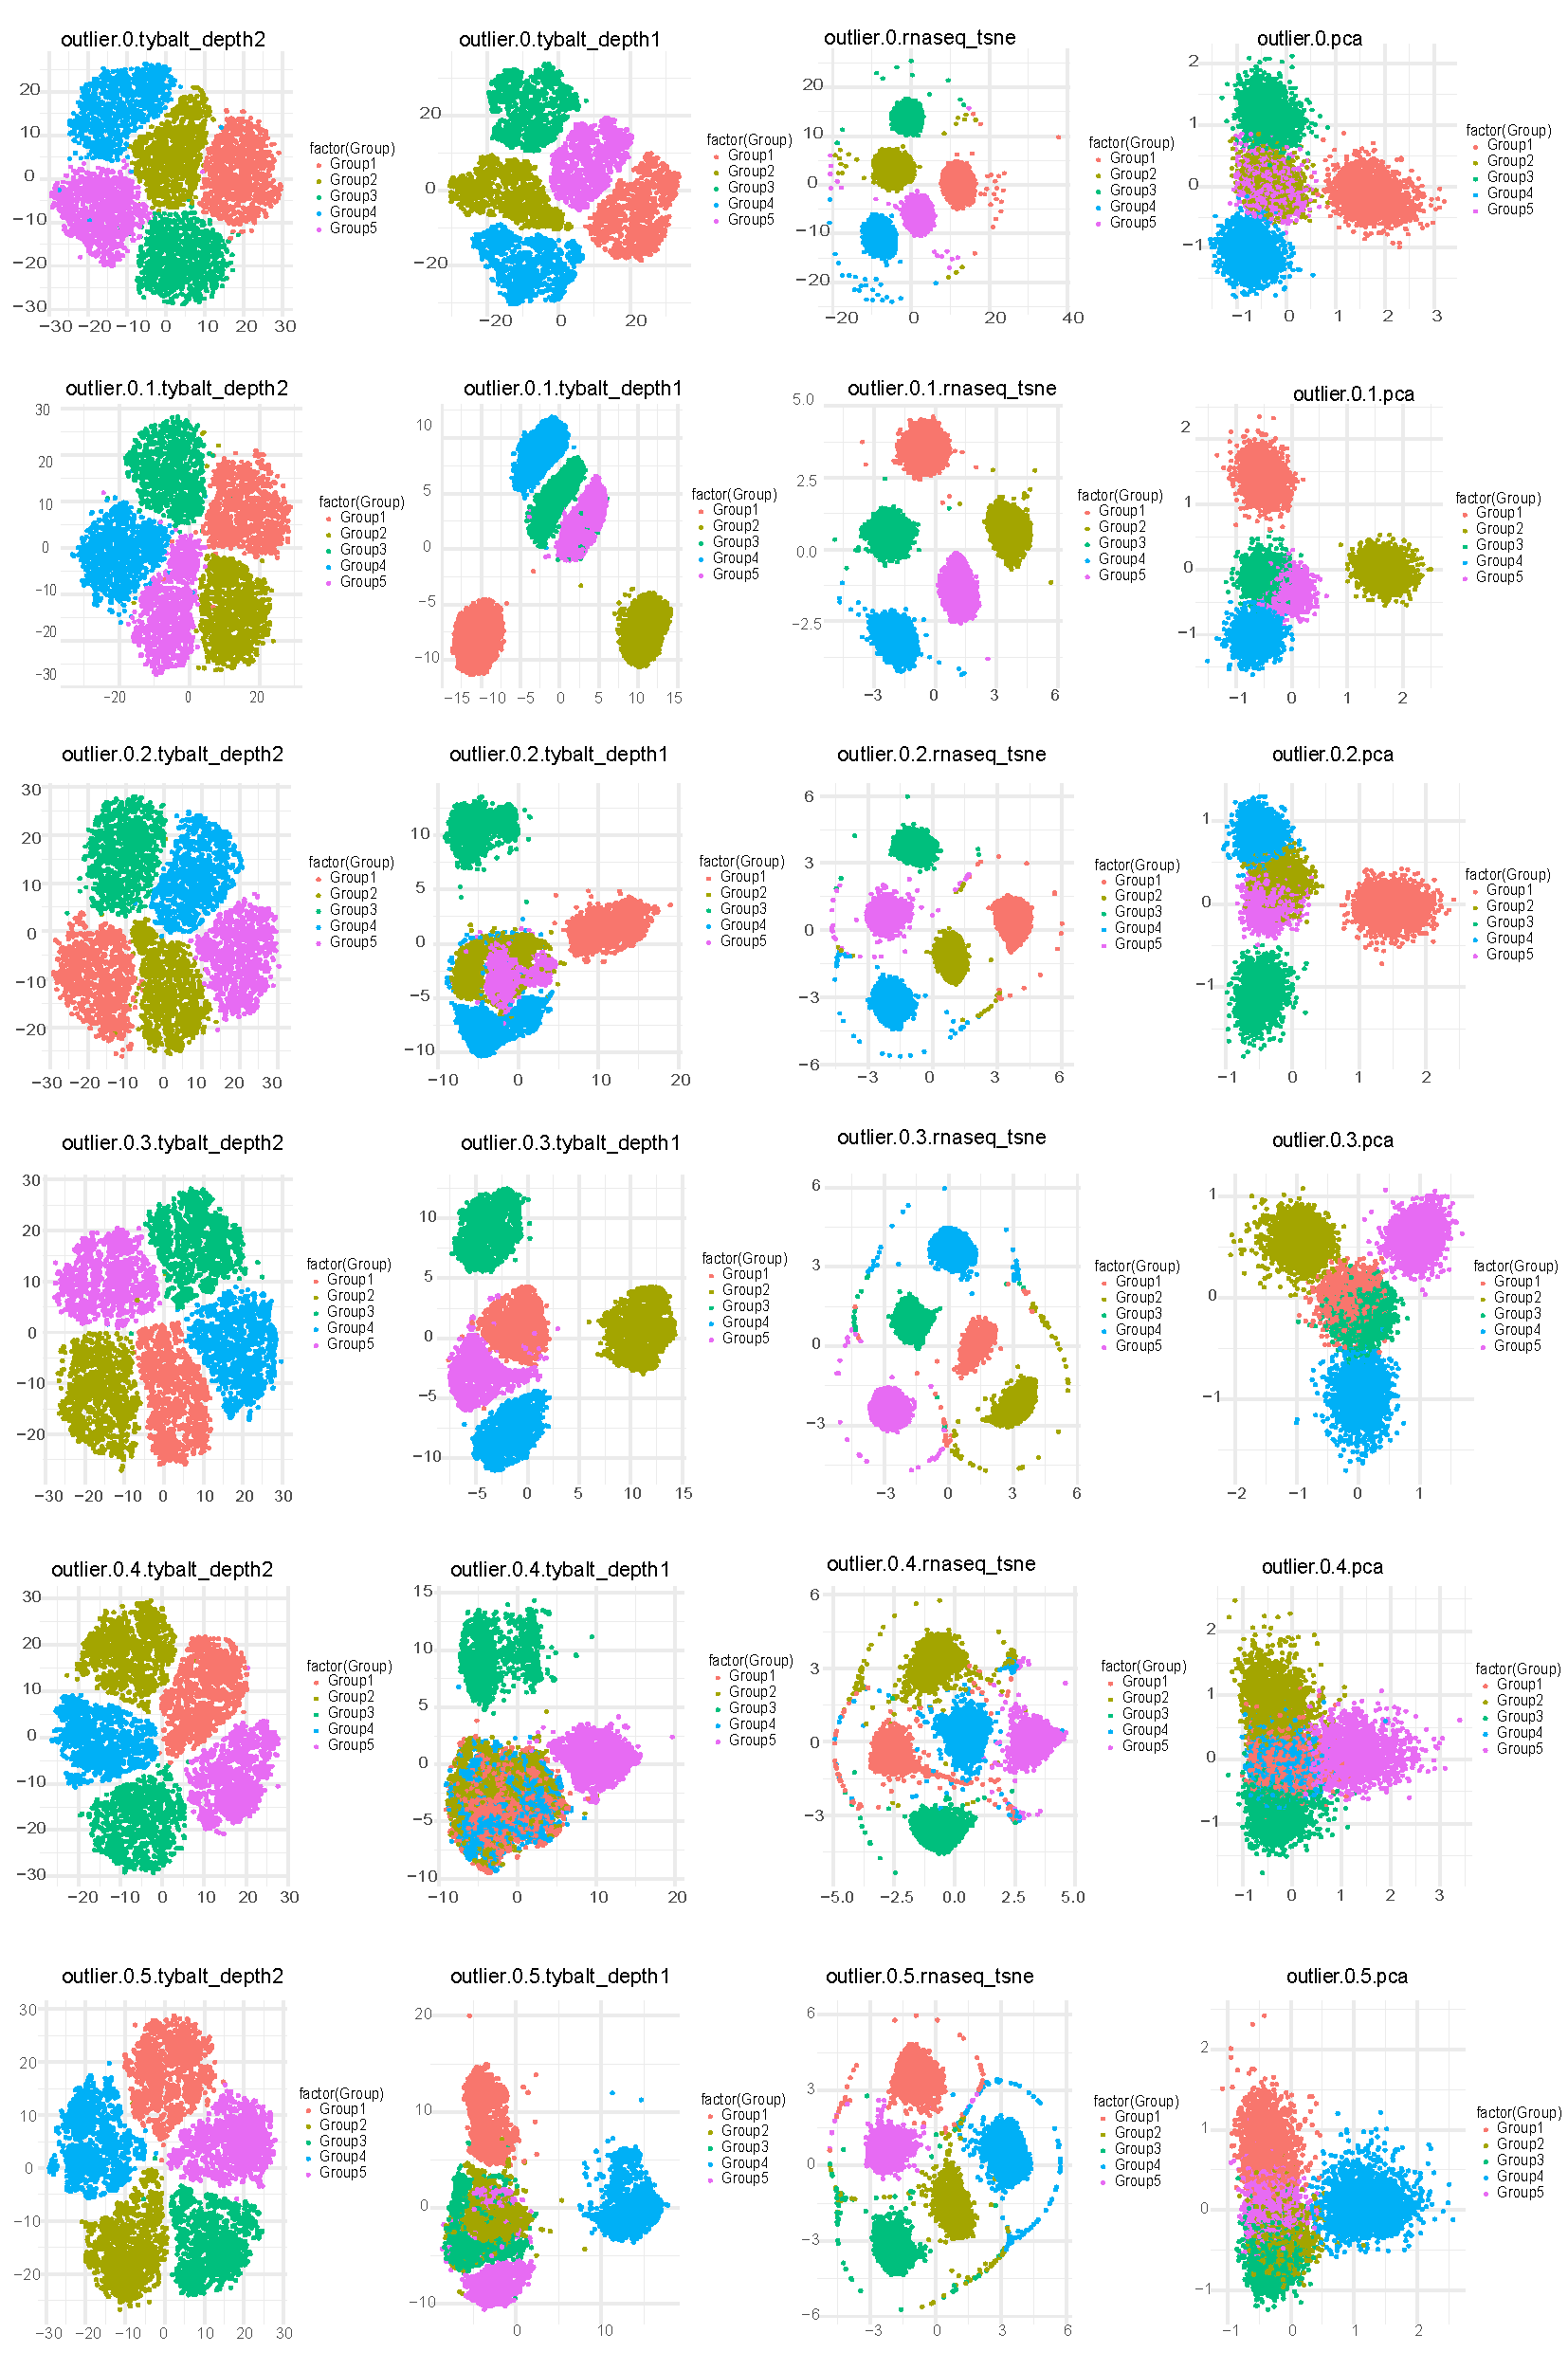
2. Visualization of simulated single cell data using VAE_depth2 (2 hidden layer), VAE_depth1 (1 hidden layer), t-SNE and PCA under different parameters
To see if different methods can recover cell types, we compared the 2D visualizations on simulated datasets. 2-layer VAE performs much better to differentiate different cell types when comparing with 1-layer VAE. The performance of VAE and t-SNE is similar and much better than PCA, but with the increase of outlier genes, 2-layer VAE is more resistant to noise.
Figure 2: 2 - layer VAE is more resistant to outlier. 2D visualization of simulated single cell data from different outlier parameters ( 0 - 0.5).
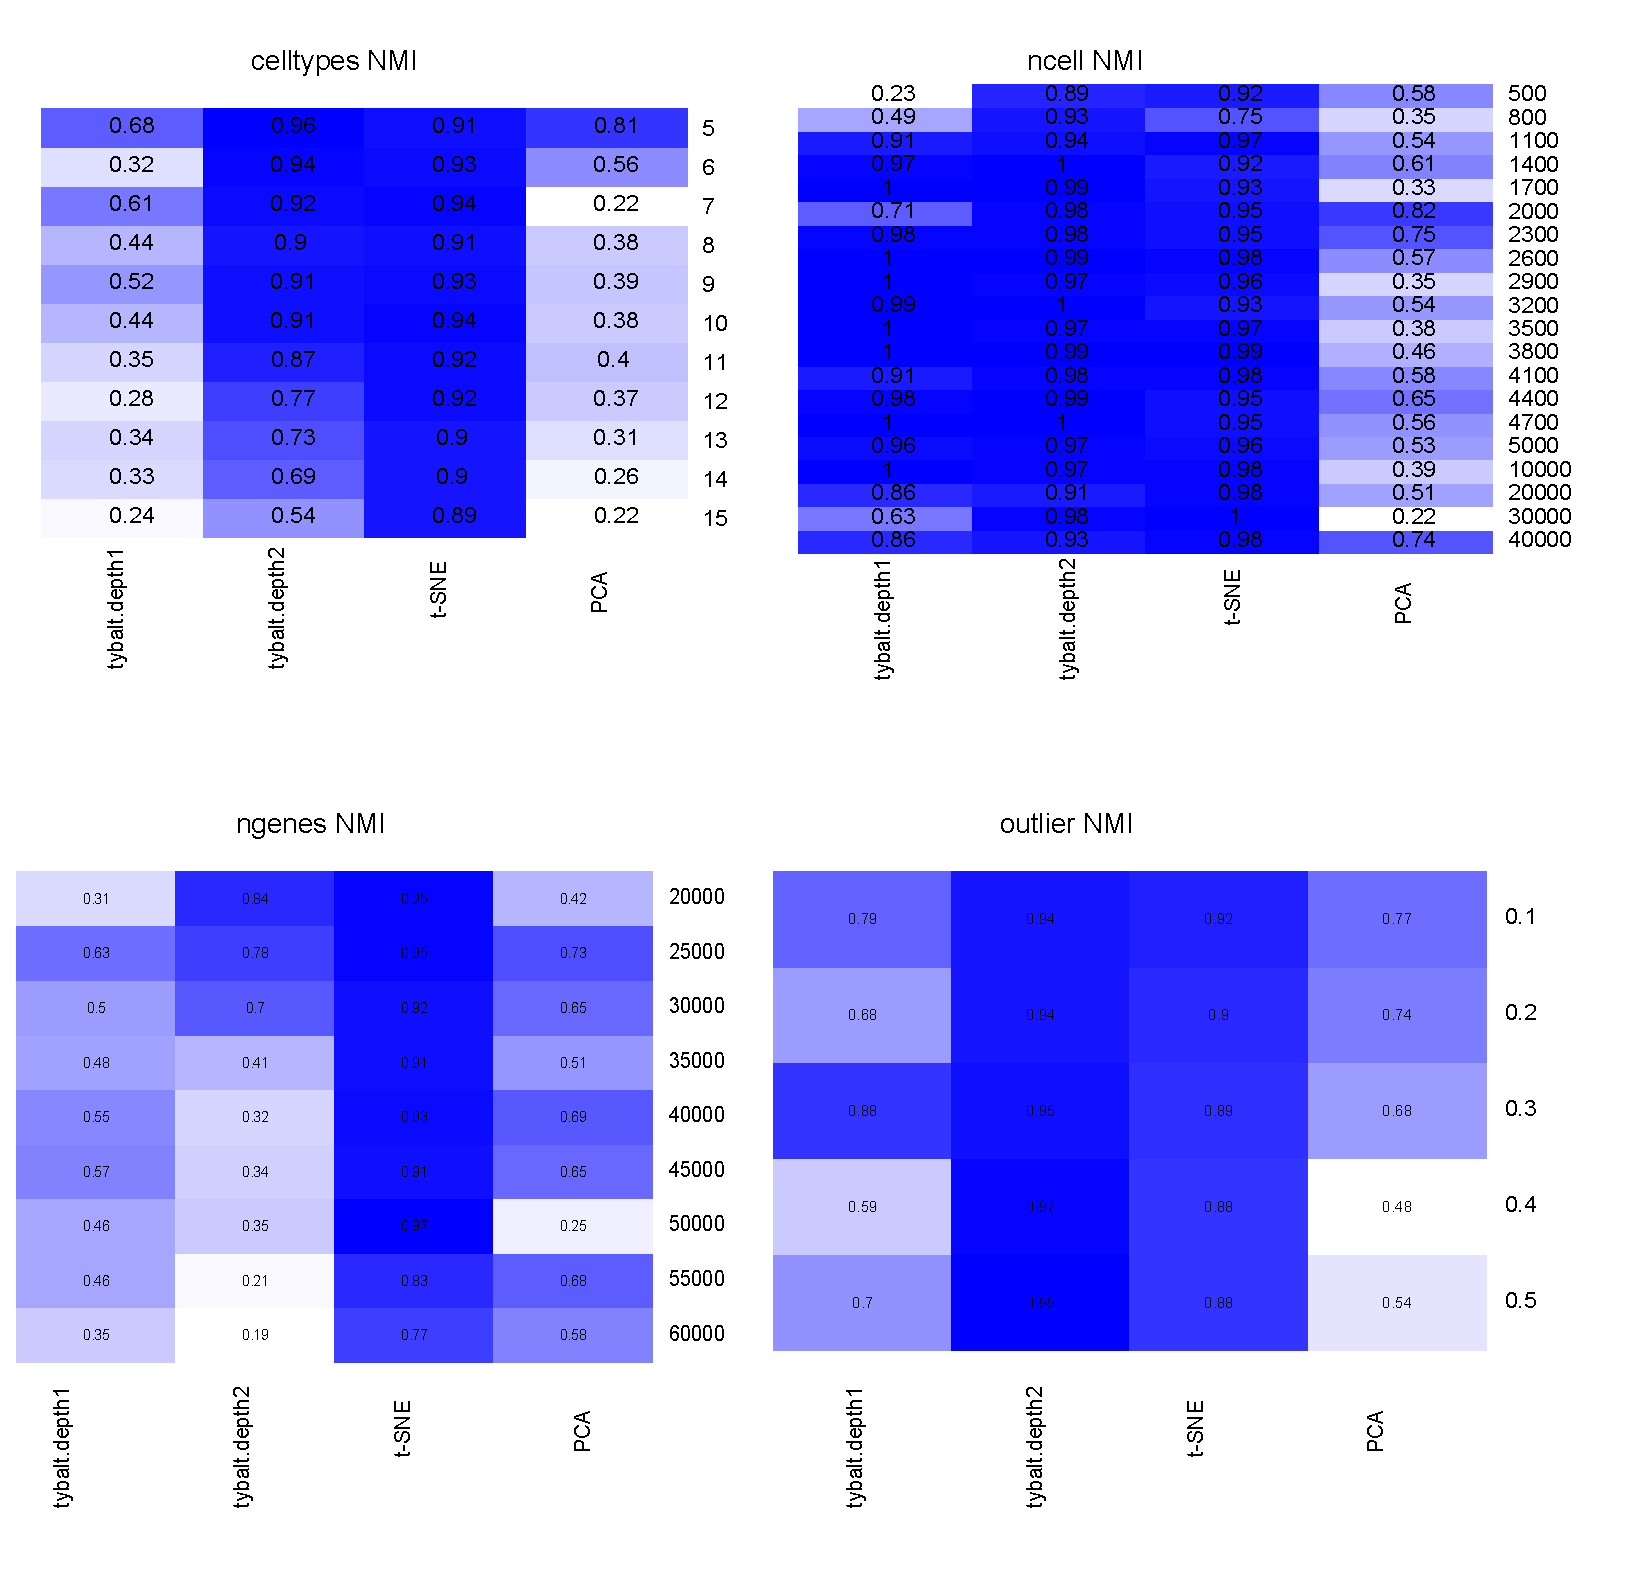
3. Performance evaluation of different simulation parameters
Clustering performance was measured by normalized mutual information (NMI). NMI is an normalization of the Mutual Information (MI, measures the dependence of two random variables). It is a measurement to determine the quality of clustering, which is between 0 (no mutual information) and 1 (perfect correlation).
Figure 3: Performance comparison among VAE, t-SNE and PCA under different simulation parameters.
4. Model sensitivity
We found VAE model was sensitive to hyperparameter tuning, especially for deeper networks. The performance of 3-layer VAE changed dramatically after parameter tuning. Our results should discourage authors and reviewers from solely relying on empirical performance comparisons to evaluate model performance. The details of these results are available in [19].
VAE performance on real single cell datasets
1. real single cell datasets:
To evaluate the performance of VAE and the other dimension reduction approaches, we selected 8 real single cell datasets with true cell type labels.
dataset
ncells
ngenes
tissue
organism
cell types
Accesion number
Platform
celltype annotation
Citation
yan
90
20214
Embryo Devel
human
6
GSE36552
Illumina HiSeq 2000
from different embryonic developmental time points
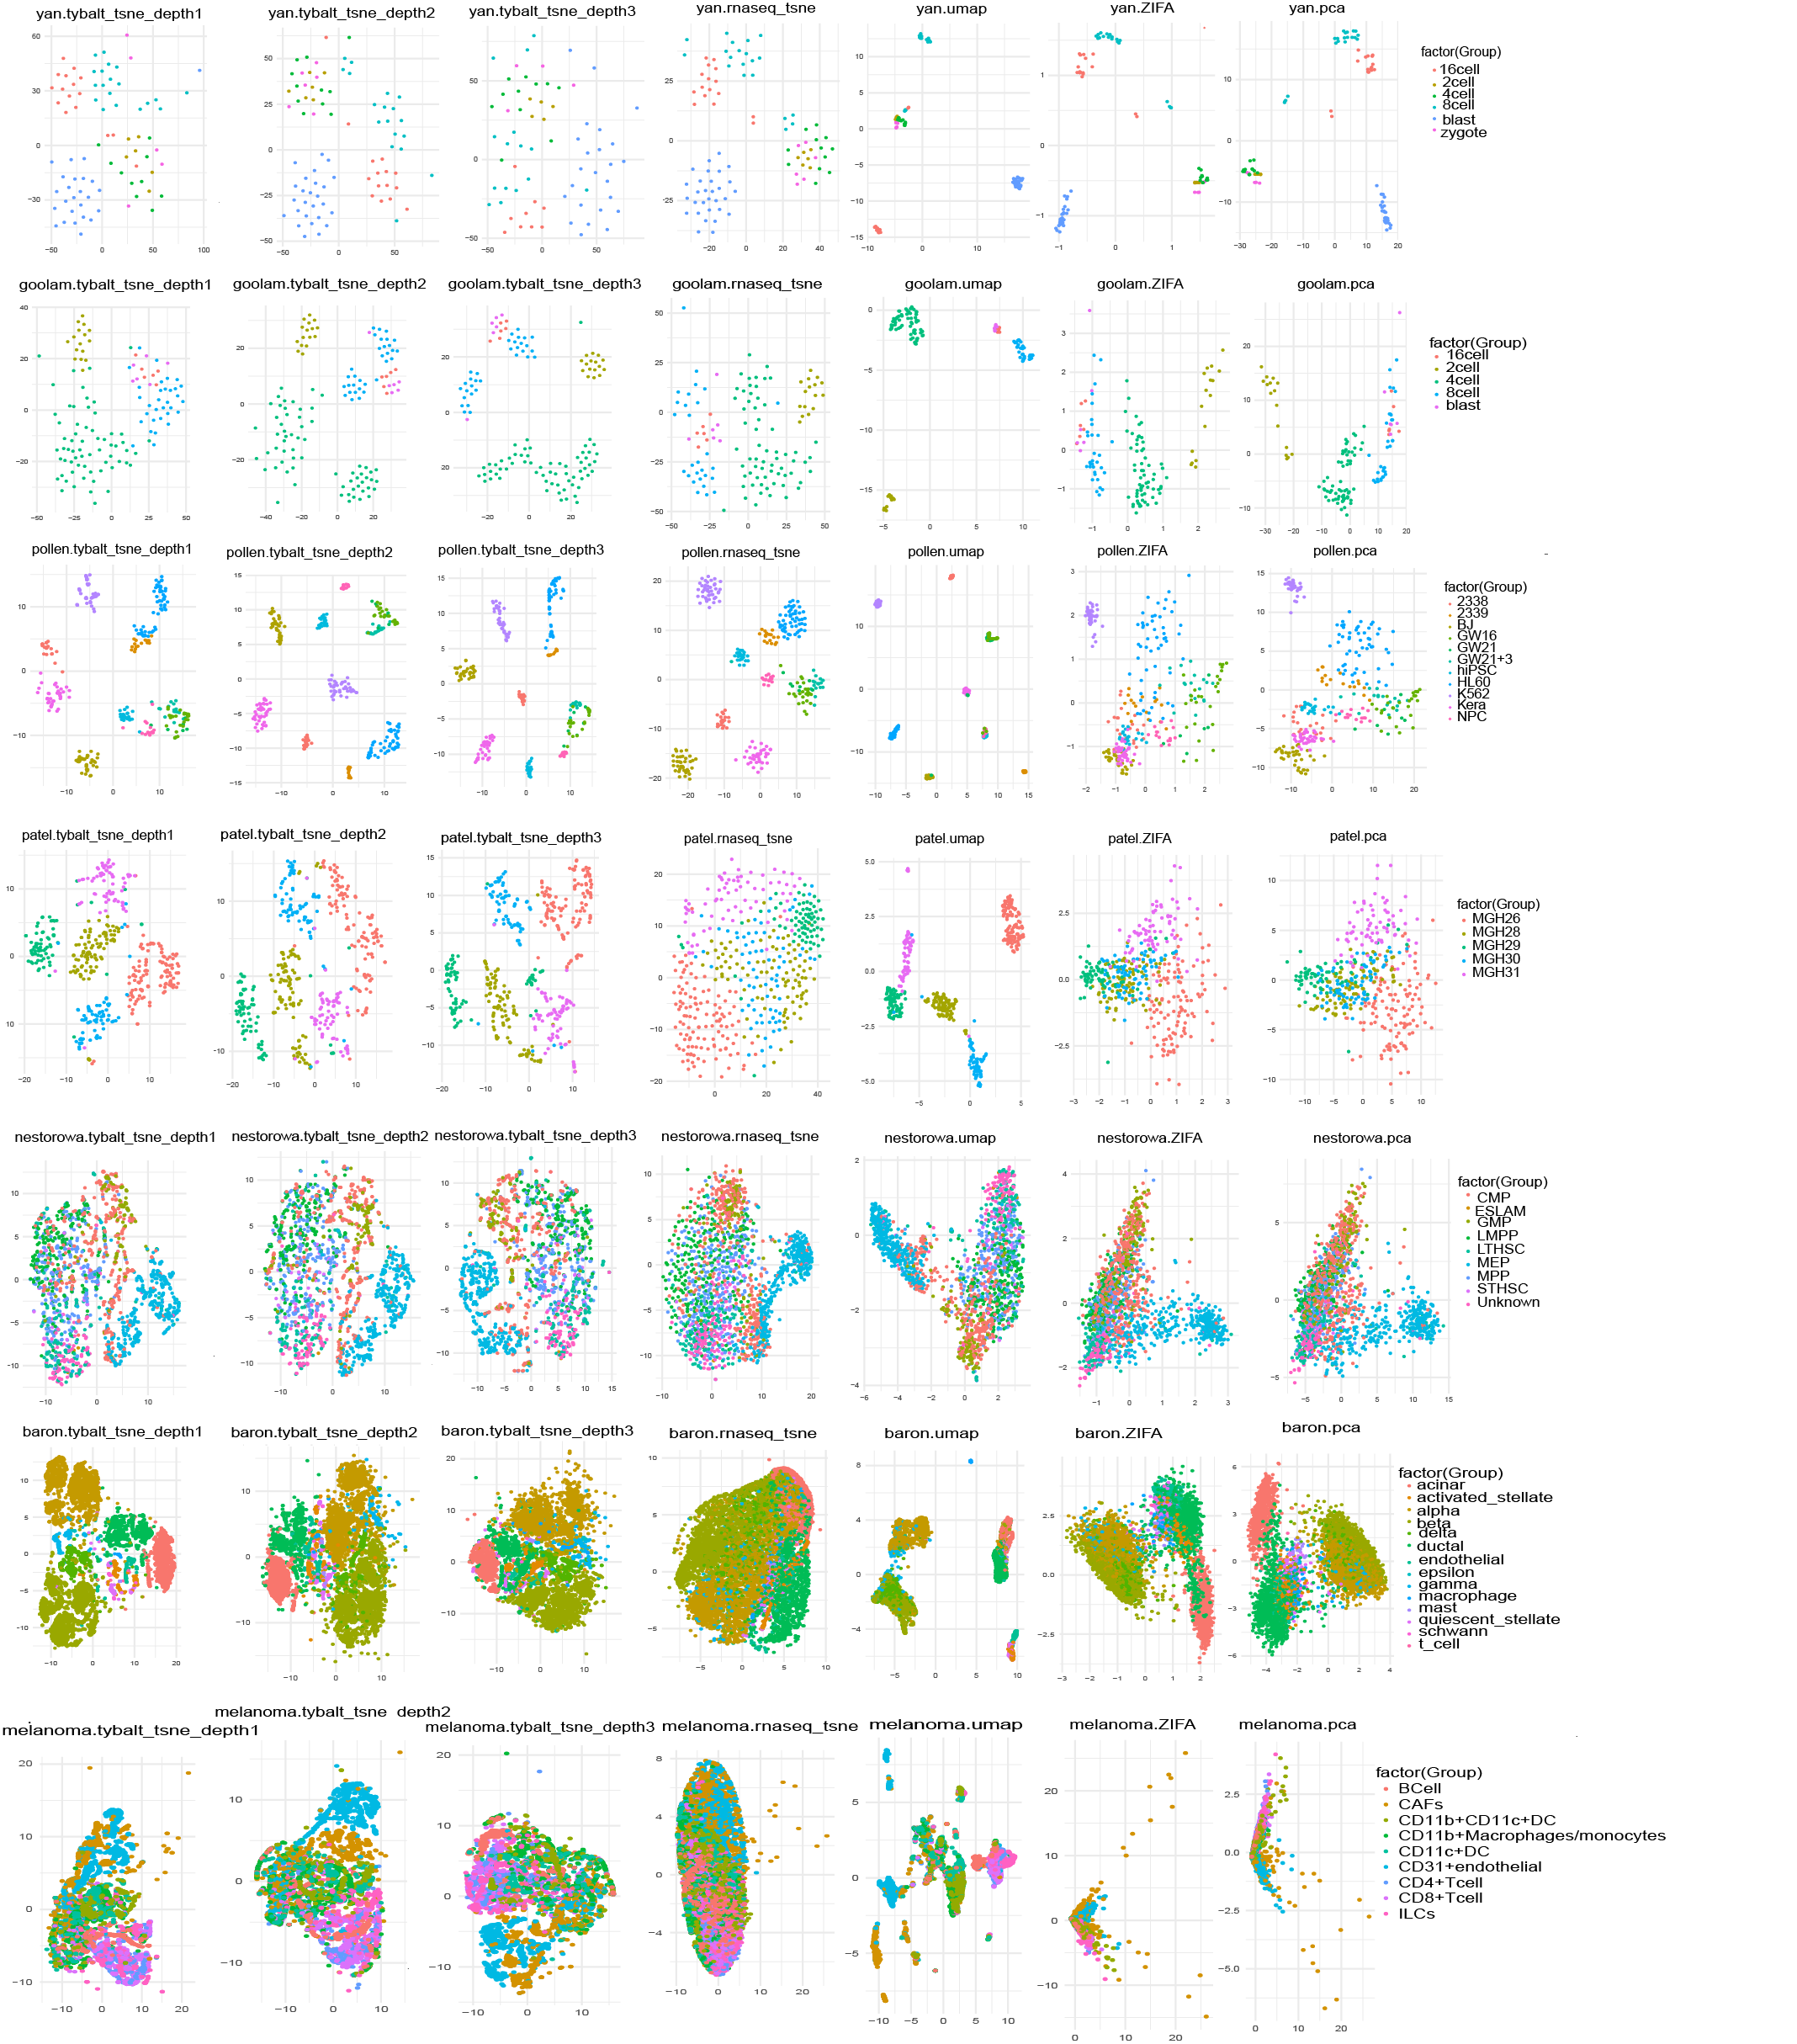
2. 2-dimensional projection of real single cell data based on differnt structure of VAE: VAE_depth3 (3 hidden layer), VAE_depth2 (2 hidden layer), VAE_depth1 (1 hidden layer), t-SNE, ZIFA, UMAP and PCA
We tested the performance of VAE and another 4 methods (t-SNE [27], ZIFA [13], UMAP [28] and PCA [30]) on these real datasets with different number of cells, genes and cell types. Figure 4 shows the 2-D visulization of the real single cell datasets. PCA and ZIFA generally perform better when number of cells is small, but with the increase of number of cells, VAE better differentiates different cell types. Increase of VAE depth does not significantly change the performance for real single cell datasets, but for the simulated data we analyzed above, VAE with higher depth is more resistant to noise and performs better with small number of cells.
Figure 4: 2D Visualization of real single cell data using VAE_depth3 (3 hidden layer), VAE_depth2 (2 hidden layer), VAE_depth1 (1 hidden layer), t-SNE, ZIFA, UMAP and PCA.
3. Performance evaluation
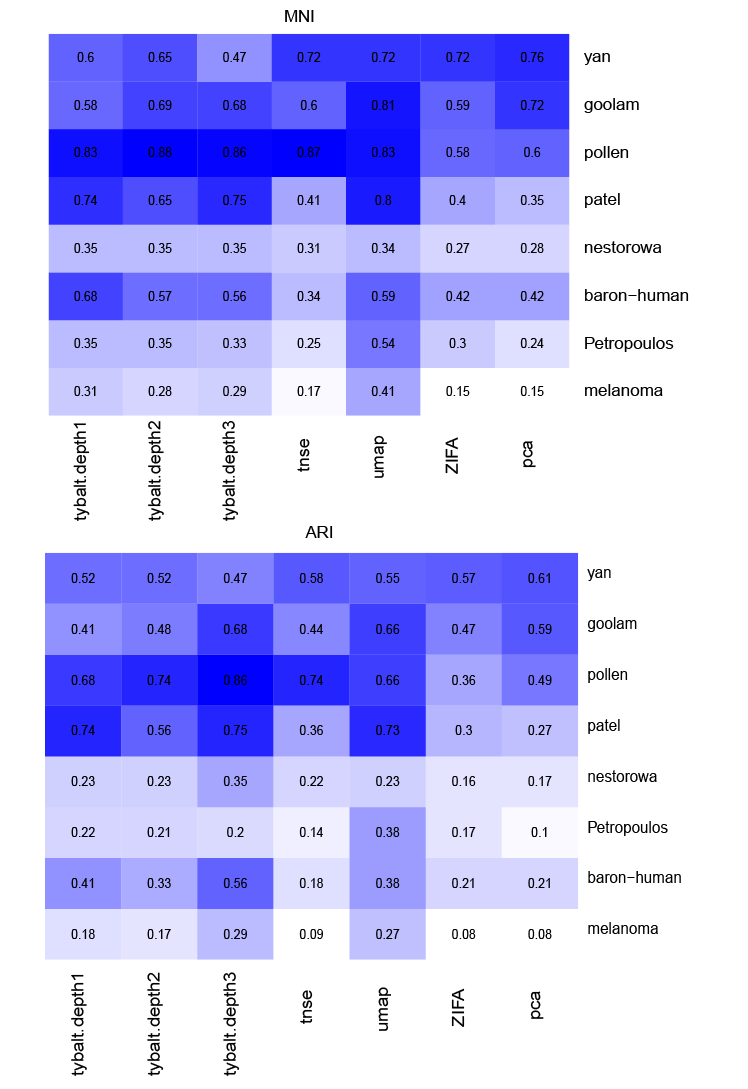
Evaluation of model performance is based on three different types of metrics: clustering based, average silhouette score and knn-based.
Clustering based approach: k-means clustering was performed based on the latent space, the model performance was measured by NMI and ARI.
Figure 5: Performance comparison among VAE, t-SNE, ZIFA, UMAP and PCA based on k-means. For dataset with fewer cells, the performance of t-SNE, umap, ZIFA and PCA is better than VAE. VAE and umap outperforms t-SNE, ZIFA and PCA whith increase number of cells.
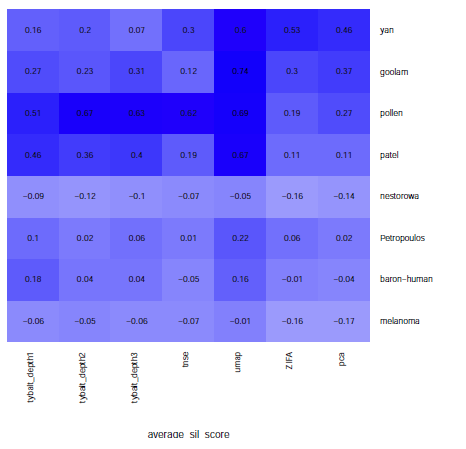
Average silhouette score: average silhouette score measures how well each points lies with its own cluster, which indicates the separability of each inidividual cluster. The value of average silluetee score is between -1 to 1, with 1 means the cluster is far away from its neighboring clusters.
Figure 6: Performance comparison among VAE, t-SNE, ZIFA, UMAP and PCA based on Average silhouette score. The average silluetee score does not differ too much for different aproaches. The performance of UMAP is generally better than the other approaches.
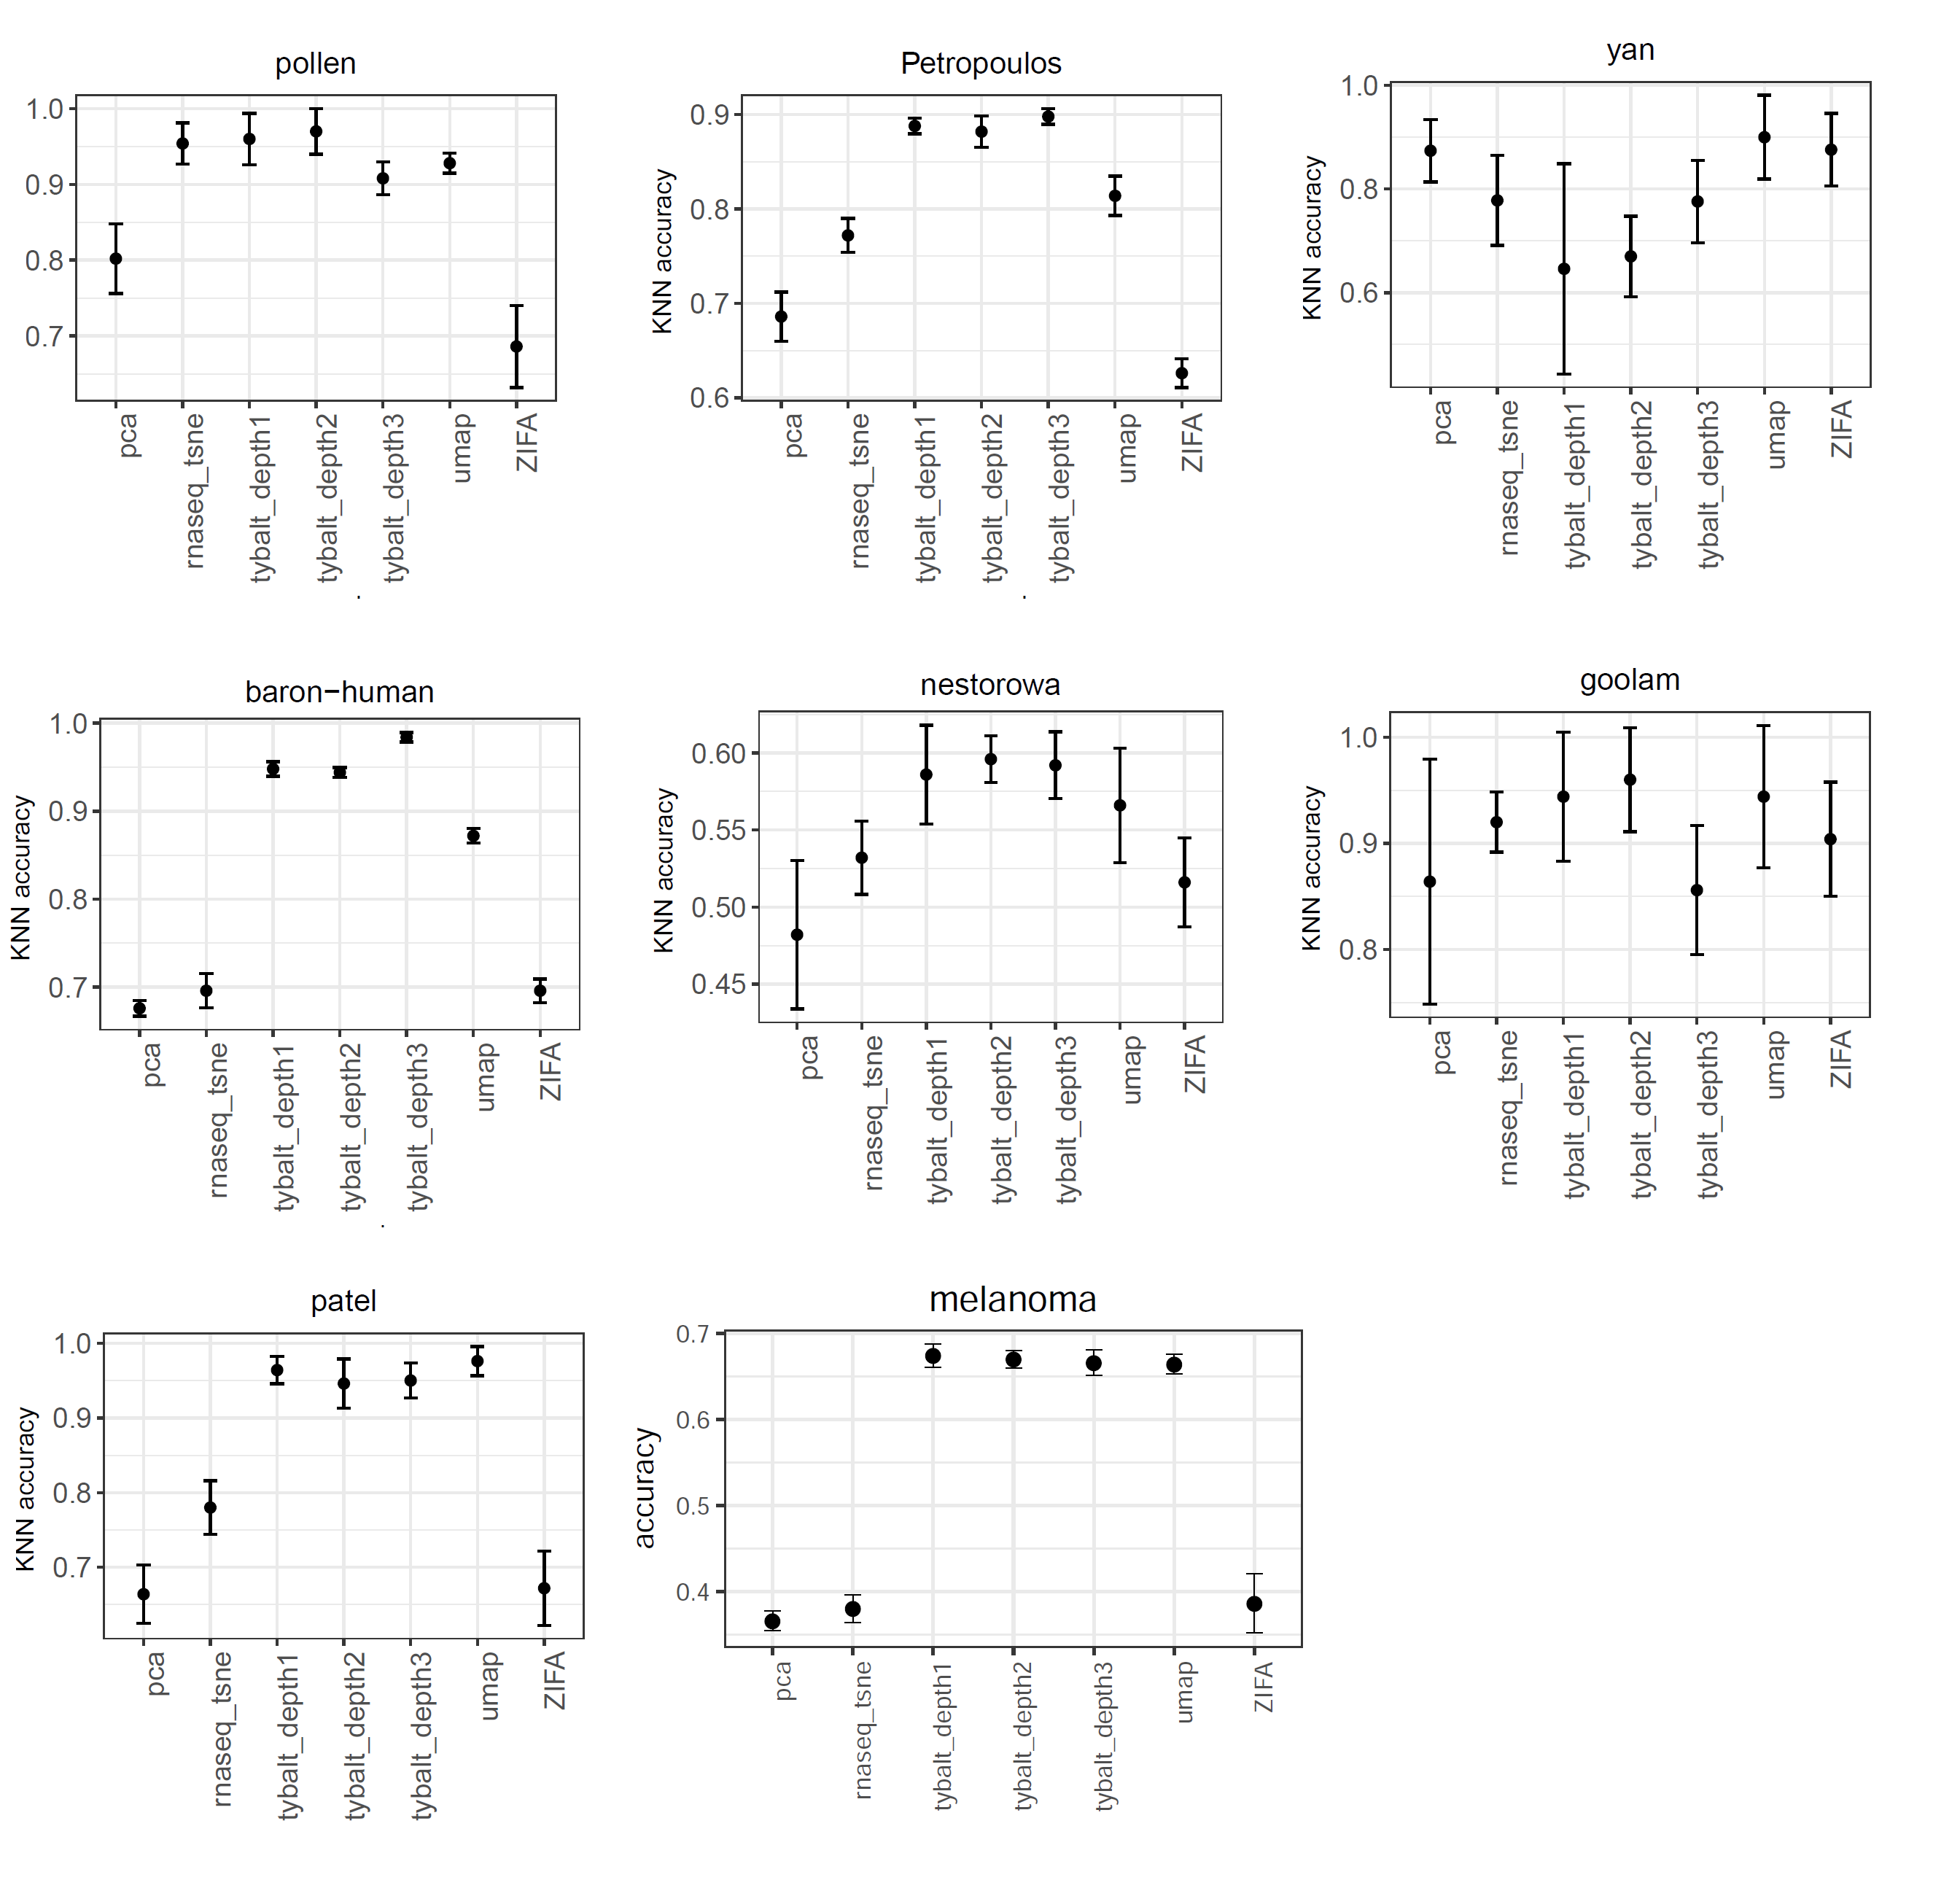
knn-based: for knn-based approach, we used k-nearest neighbor algorithm to learn the pattern based on the low dimensional latent space, then the performance of classifier was measured by 5-fold cross validation. The performance of VAE is generally better than the other approaches for majority of the real datasets.
Figure 7: Performance comparison VAE, t-SNE, ZIFA, UMAP and PCA based on k-nearest neighbor algorithm.
Data augmentation
Data augmentation is a way to reduce overfitting on models by increasing the amount of training data using information only in the current training set. In images, data augmentation can be obtained by arbitrary rotations, zooms, and other irrelevant transformations of images to increase the amount of training data, which allows a deep learning model to capture the differences from the data and reduces the model’s propensity to learn noise. The same concept also applies to single-cell transcriptomes. We hypothesized that genomic data augmentation will improve latent feature generalization by separating biological from technical features and increasing the effective sample size during training.
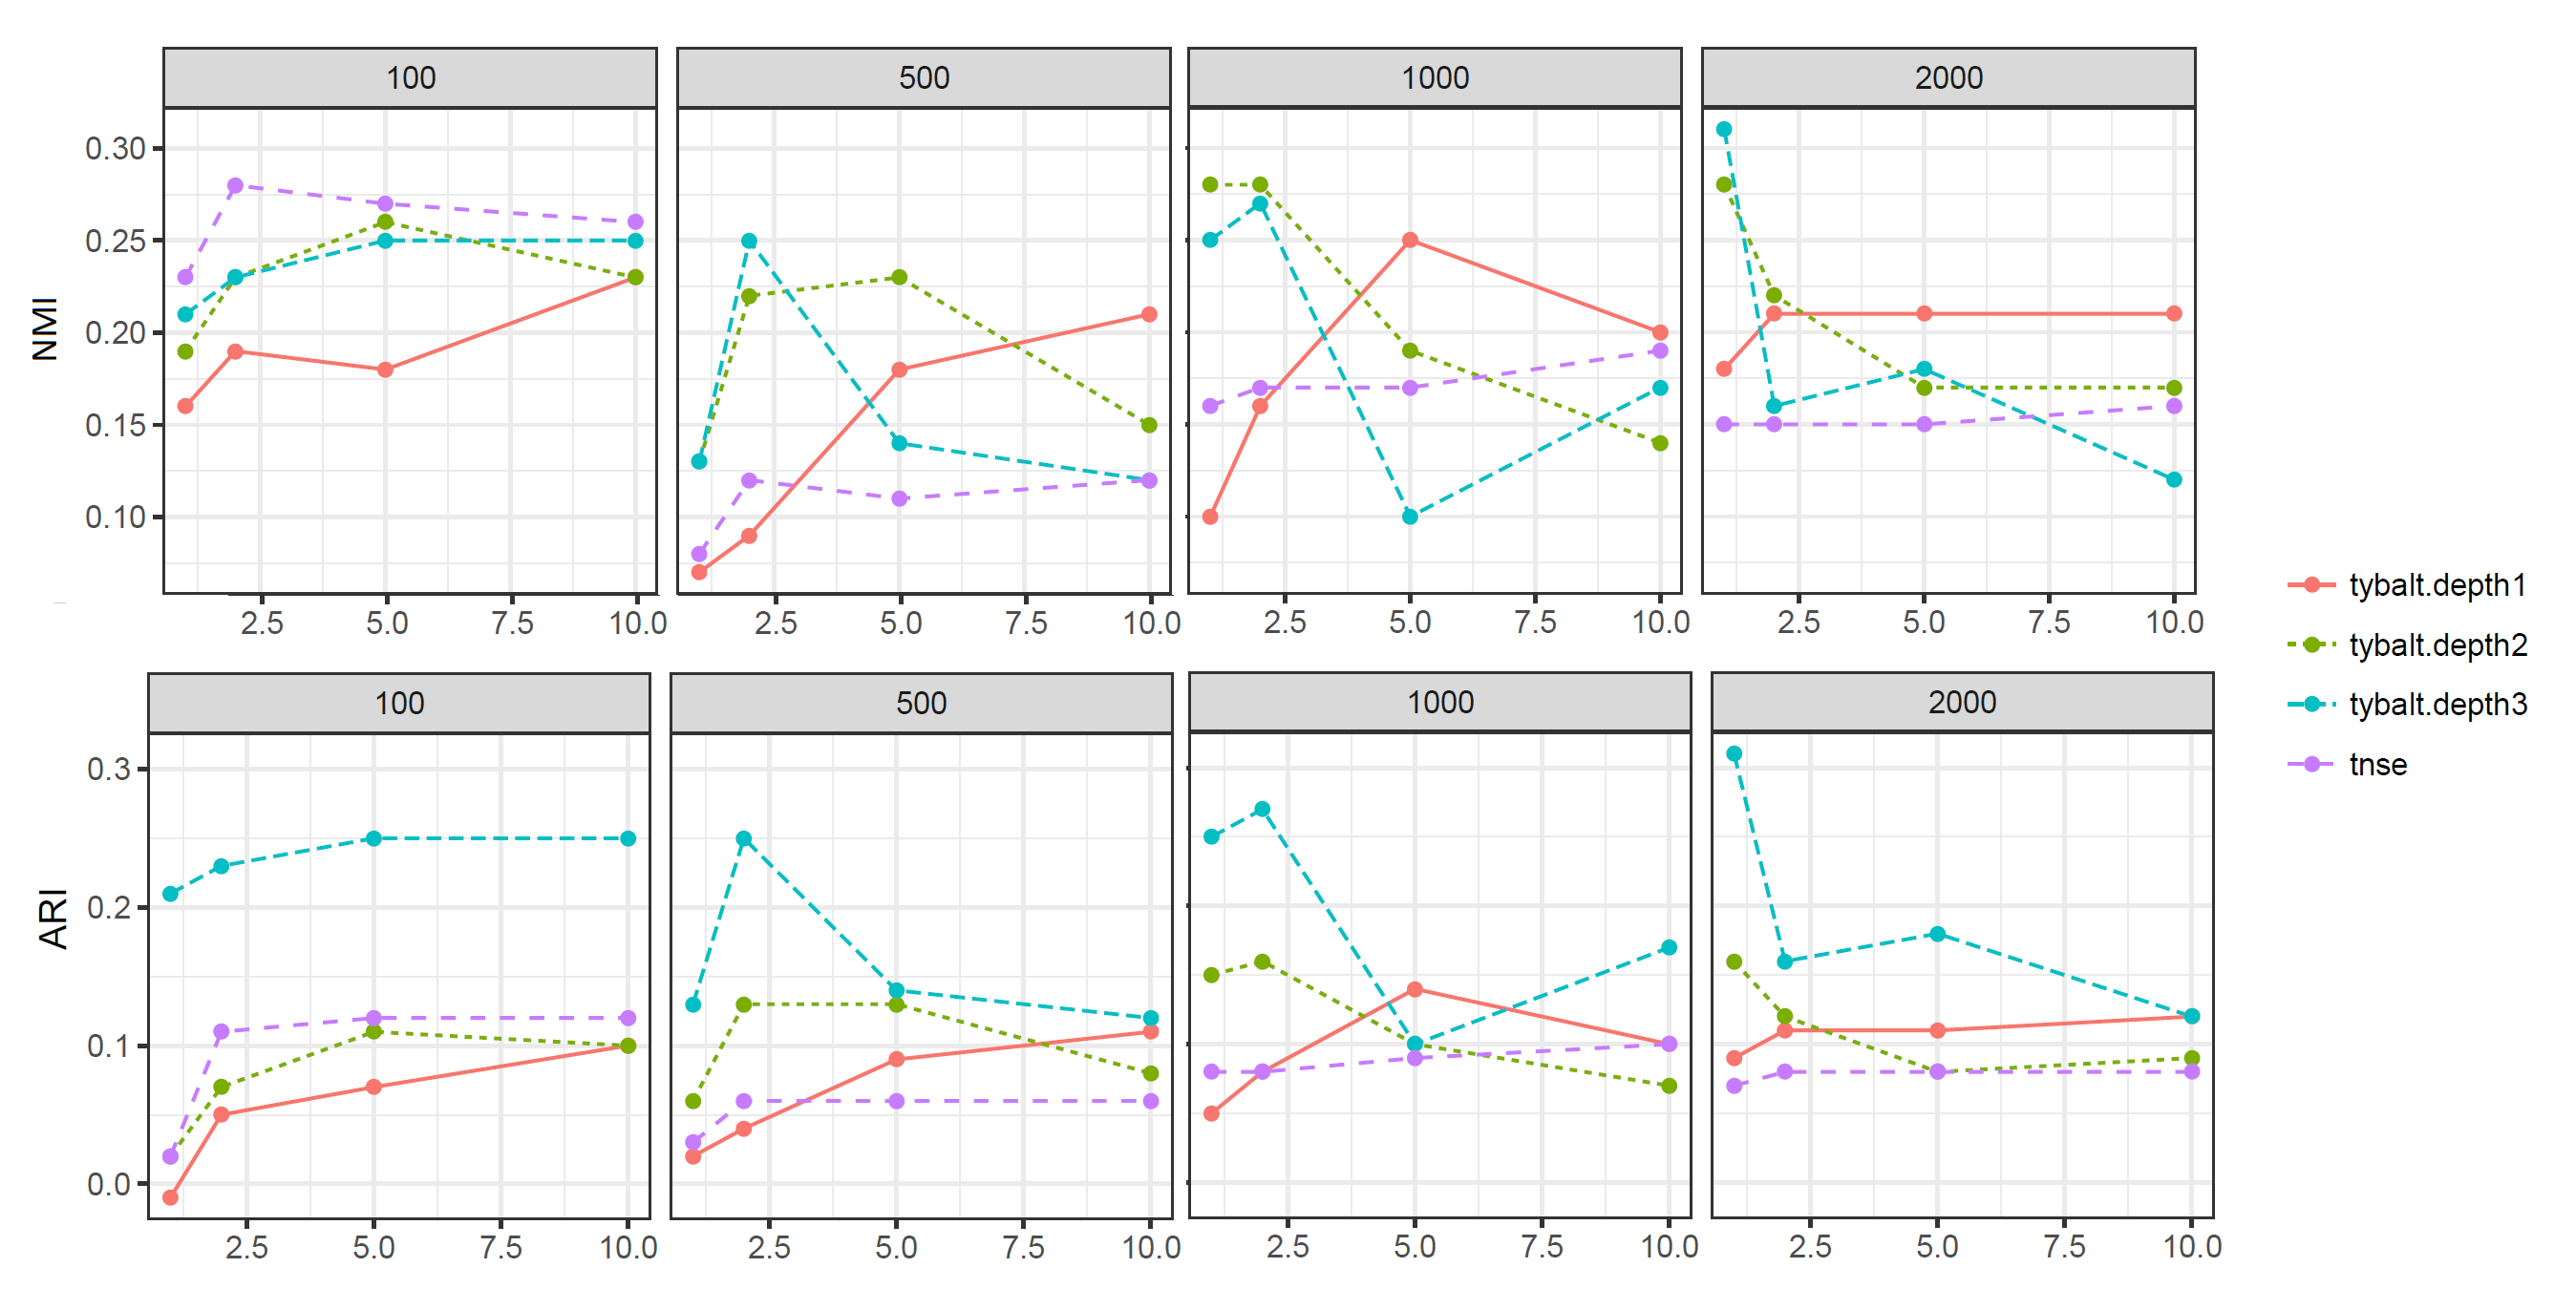
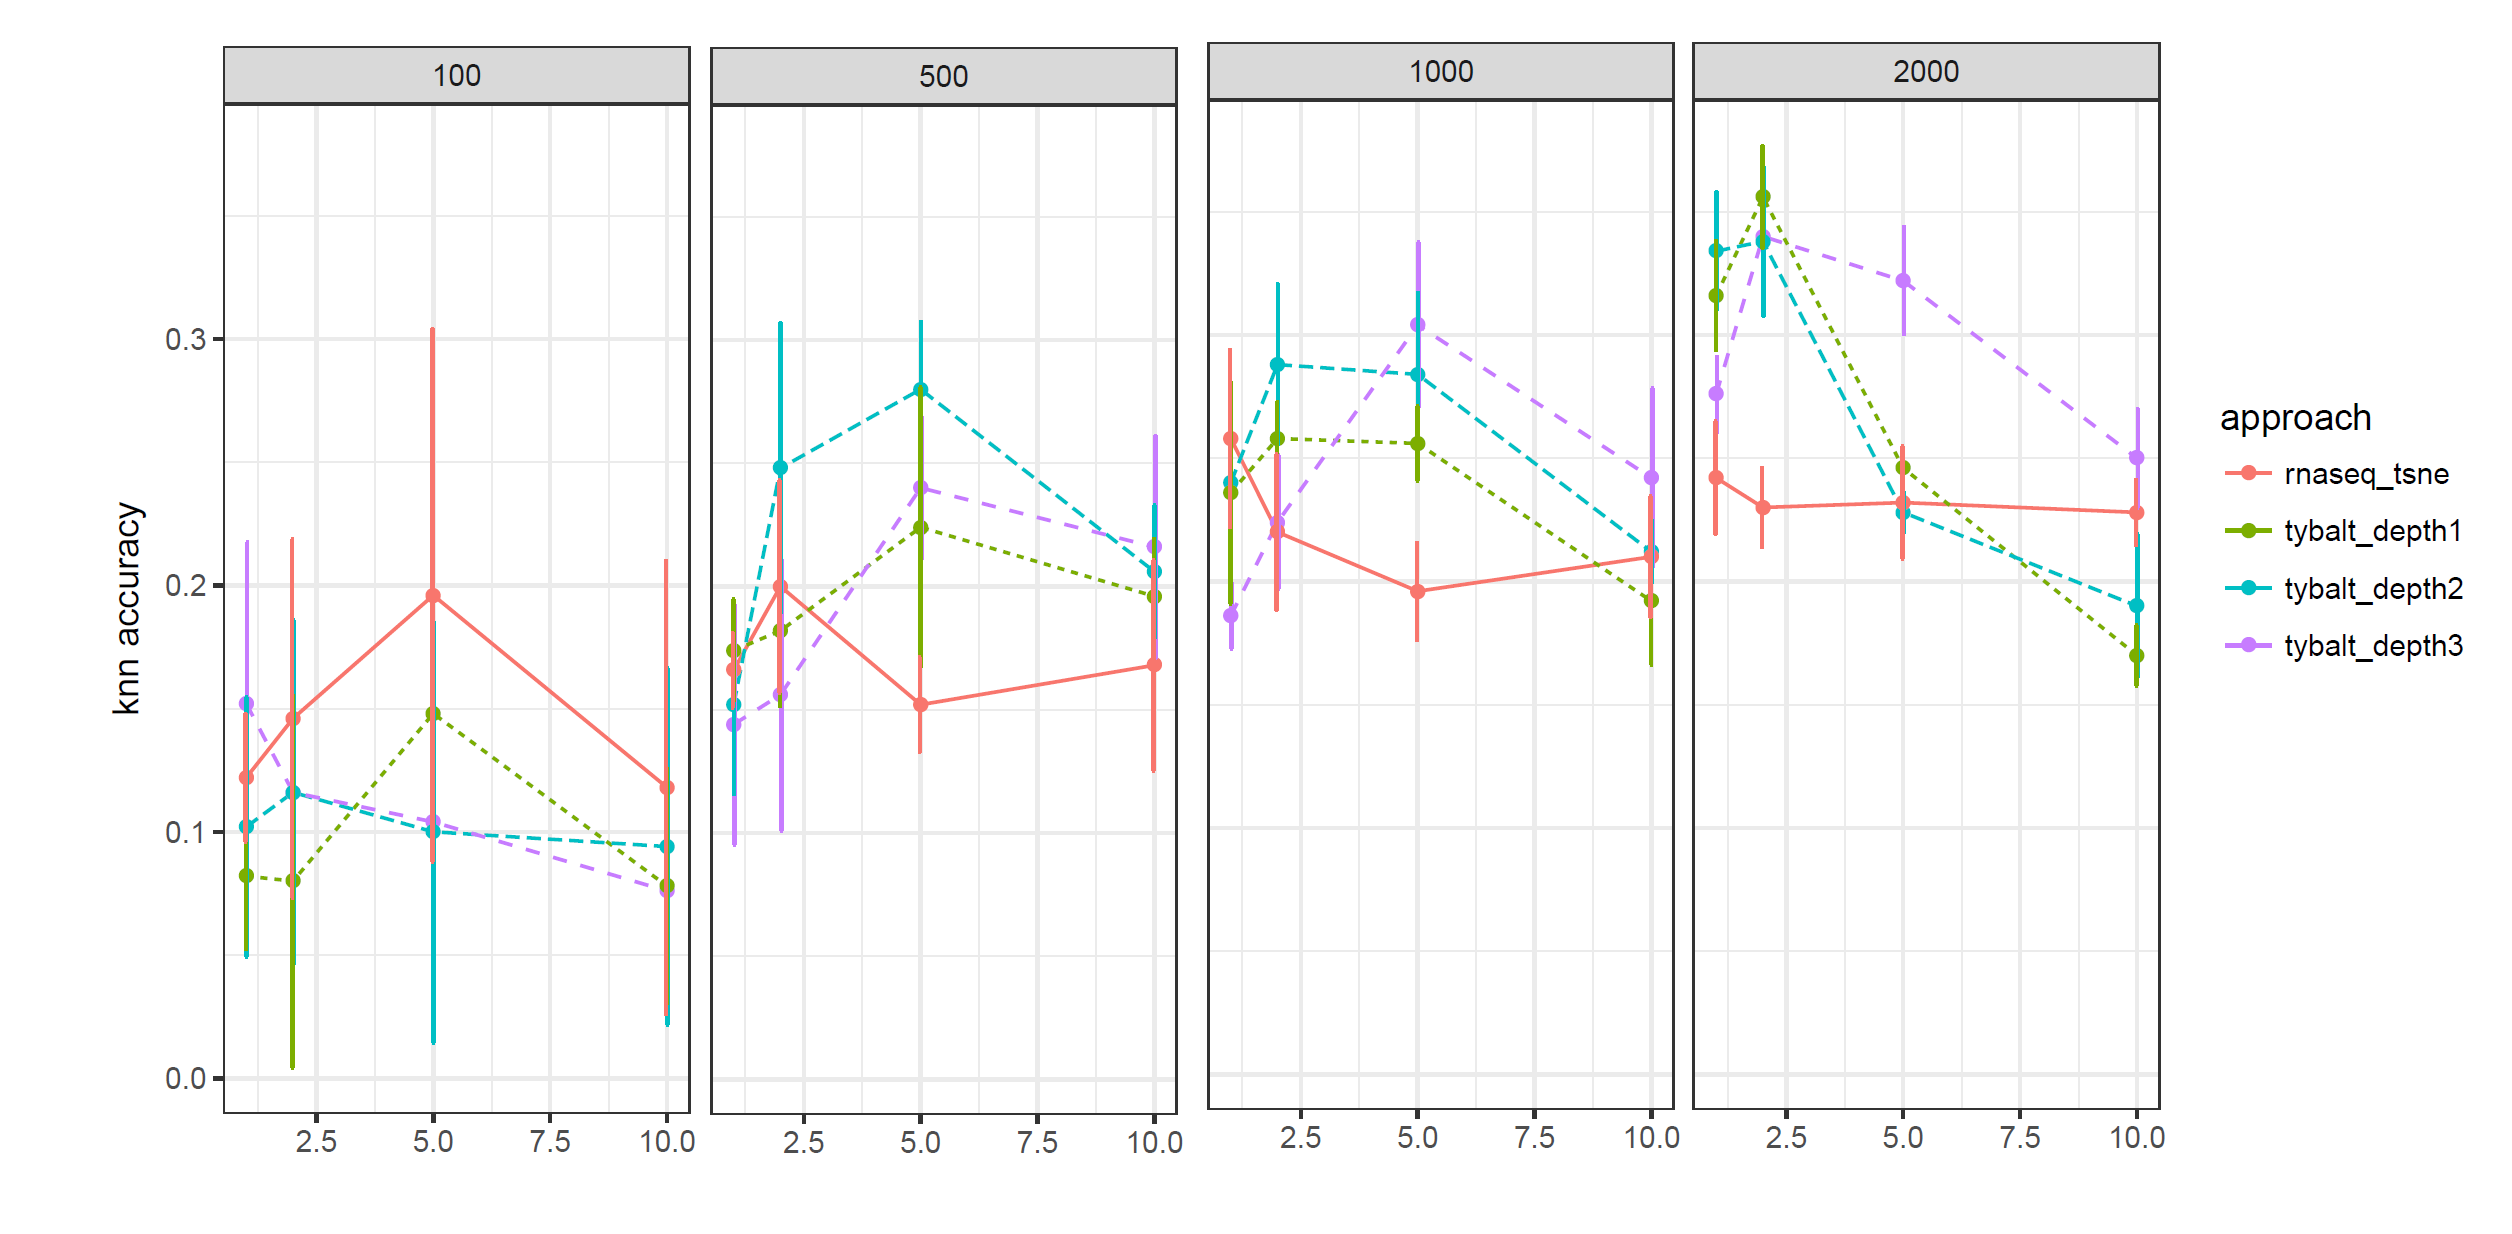
We performed data augmentation based on HCA melanoma dataset. We down sampled the melanoma dataset to test the method stability. The dataset was bootstrapped with 100, 500, 1000 and 2000 cells. We expected data augmentation will contribute more for small number of cells rather than large number of cells. Salmon (version 0.8.1) [16] was used to do the transcript abundance quantification and we resampled the reads by 2x, 5x and 10x times to capture the uncertainty in the data.
Figure 8 and 9 show the performance of data augmentation under different conditions. K-means and Knn based performance both indicate data augmentation works well for very small numbers of cells (100), but does not appear to help when the number of cells is modest (2000).
Figure 8: K-means based performance for data augmentation on HCA melanoma dataset. The dataset was bootstrapped with 100, 500, 1000 and 2000 cells. Reads were resampled by 2x, 5x and 10x times to capture the uncertainty in the data.
Figure 9: KNN based performance for data augmentation on HCA melanoma dataset. The dataset was bootstrapped with 100, 500, 1000 and 2000 cells. Reads were resampled by 2x, 5x and 10x times to capture the uncertainty in the data.
Aim 2: Generate a benchmark dataset of harmonized public data to evaluate the extent to which HCA cell types capture rheumatic disease biology.
The HCA’s partnership with the Immunological Genome Project (immgenH) will provide single-cell gene expression-based immunocyte phenotyping at an unprecedented resolution. A compendium comprised of bulk gene expression data from autoimmune/rheumatic diseases is exceptionally well-suited to evaluating the disease relevance of these immunocyte data. The objective of this aim is to build and share real and simulated benchmark datasets to evaluate the quality of the cell-type signatures. This will allow CZI to evaluate techniques, including VAEs and other methods, for defining cell-type-specific expression signatures from the HCA’s single-cell datasets by measuring their ability to decompose bulk, whole-tissue autoimmune/rheumatic disease data.
We will generate simulated bulk datasets drawn from HCA-identified cell types by combining their expression profiles at different proportions. We will also build a multi-tissue autoimmune/rheumatic disease compendium from existing public datasets that we have curated (currently more than 12,000 samples). This compendium includes samples from patients with systemic lupus erythematosus (SLE), sarcoidosis, and inflammatory bowel disorders among many other diseases. Such a compendium lets us determine the extent to which HCA-derived cell type signatures capture disease-relevant information in a way that matches previous literature. For instance, we expect to detect higher proportions of activated macrophages in lupus nephritis samples than controls [31].
These bulk compendia (simulated and real data) will enable HCA participants (computational-method and molecular-assay developers) to directly compare approaches where we expect their most immediate translational impact: application to existing datasets to explain disease-relevant phenomena via a single-cell perspective.
2. DRAW: A Recurrent Neural Network For Image Generation
Karol Gregor, Ivo Danihelka, Alex Graves, Danilo Jimenez Rezende, Daan Wierstra arXiv (2015-02-16) https://arxiv.org/abs/1502.04623v2
3. GANs for Biological Image Synthesis
Anton Osokin, Anatole Chessel, Rafael E. Carazo Salas, Federico Vaggi arXiv (2017-08-15) https://arxiv.org/abs/1708.04692v2
4. ADAGE-Based Integration of Publicly Available Pseudomonas aeruginosa Gene Expression Data with Denoising Autoencoders Illuminates Microbe-Host Interactions
Jie Tan, John H. Hammond, Deborah A. Hogan, Casey S. Greene mSystems (2016-01-19) https://doi.org/10.1128/msystems.00025-15
5. Unsupervised Extraction of Stable Expression Signatures from Public Compendia with an Ensemble of Neural Networks
Jie Tan, Georgia Doing, Kimberley A. Lewis, Courtney E. Price, Kathleen M. Chen, Kyle C. Cady, Barret Perchuk, Michael T. Laub, Deborah A. Hogan, Casey S. Greene Cell Systems (2017-07) https://doi.org/10.1016/j.cels.2017.06.003
6. ADAGE signature analysis: differential expression analysis with data-defined gene sets
Jie Tan, Matthew Huyck, Dongbo Hu, Rene A. Zelaya, Deborah A. Hogan, Casey S. Greene Cold Spring Harbor Laboratory (2017-06-27) https://doi.org/10.1101/156620
7. Privacy-preserving generative deep neural networks support clinical data sharing
Brett K. Beaulieu-Jones, Zhiwei Steven Wu, Chris Williams, Ran Lee, Sanjeev P Bhavnani, James Brian Byrd, Casey S. Greene Cold Spring Harbor Laboratory (2017-07-05) https://doi.org/10.1101/159756
8. Extracting a Biologically Relevant Latent Space from Cancer Transcriptomes with Variational Autoencoders
Gregory P. Way, Casey S. Greene Cold Spring Harbor Laboratory (2017-08-11) https://doi.org/10.1101/174474
9. Reproducibility of computational workflows is automated using continuous analysis
Brett K Beaulieu-Jones, Casey S Greene Nature Biotechnology (2017-03-13) https://doi.org/10.1038/nbt.3780
11. Generative Adversarial Networks
Ian J. Goodfellow, Jean Pouget-Abadie, Mehdi Mirza, Bing Xu, David Warde-Farley, Sherjil Ozair, Aaron Courville, Yoshua Bengio arXiv (2014-06-10) https://arxiv.org/abs/1406.2661v1
13. ZIFA: Dimensionality reduction for zero-inflated single-cell gene expression analysis
Emma Pierson, Christopher Yau Genome Biology (2015-11-02) https://doi.org/10.1186/s13059-015-0805-z
14. Graphical Models for Zero-Inflated Single Cell Gene Expression
Andrew McDavid, Raphael Gottardo, Noah Simon, Mathias Drton arXiv (2016-10-19) https://arxiv.org/abs/1610.05857v3
15. CIDR: Ultrafast and accurate clustering through imputation for single-cell RNA-seq data
Peijie Lin, Michael Troup, Joshua W. K. Ho Genome Biology (2017-03-28) https://doi.org/10.1186/s13059-017-1188-0
16. Salmon provides fast and bias-aware quantification of transcript expression
Rob Patro, Geet Duggal, Michael I Love, Rafael A Irizarry, Carl Kingsford Nature Methods (2017-03-06) https://doi.org/10.1038/nmeth.4197
17. Near-optimal probabilistic RNA-seq quantification
Nicolas L Bray, Harold Pimentel, Páll Melsted, Lior Pachter Nature Biotechnology (2016-04-04) https://doi.org/10.1038/nbt.3519
18. Splatter: simulation of single-cell RNA sequencing data
Luke Zappia, Belinda Phipson, Alicia Oshlack Genome Biology (2017-09-12) https://doi.org/10.1186/s13059-017-1305-0
19. Parameter tuning is a key part of dimensionality reduction via deep variational autoencoders for single cell RNA transcriptomics
Qiwen Hu, Casey S Greene Cold Spring Harbor Laboratory (2018-08-05) https://doi.org/10.1101/385534
20. Single-cell RNA-Seq profiling of human preimplantation embryos and embryonic stem cells
Liying Yan, Mingyu Yang, Hongshan Guo, Lu Yang, Jun Wu, Rong Li, Ping Liu, Ying Lian, Xiaoying Zheng, Jie Yan, … Fuchou Tang Nature Structural & Molecular Biology (2013-08-11) https://doi.org/10.1038/nsmb.2660
21. Heterogeneity in Oct4 and Sox2 Targets Biases Cell Fate in 4-Cell Mouse Embryos
Mubeen Goolam, Antonio Scialdone, Sarah J.L. Graham, Iain C. Macaulay, Agnieszka Jedrusik, Anna Hupalowska, Thierry Voet, John C. Marioni, Magdalena Zernicka-Goetz Cell (2016-03) https://doi.org/10.1016/j.cell.2016.01.047
22. Low-coverage single-cell mRNA sequencing reveals cellular heterogeneity and activated signaling pathways in developing cerebral cortex
Alex A Pollen, Tomasz J Nowakowski, Joe Shuga, Xiaohui Wang, Anne A Leyrat, Jan H Lui, Nianzhen Li, Lukasz Szpankowski, Brian Fowler, Peilin Chen, … Jay AA West Nature Biotechnology (2014-08-03) https://doi.org/10.1038/nbt.2967
23. Single-cell RNA-seq highlights intratumoral heterogeneity in primary glioblastoma
A. P. Patel, I. Tirosh, J. J. Trombetta, A. K. Shalek, S. M. Gillespie, H. Wakimoto, D. P. Cahill, B. V. Nahed, W. T. Curry, R. L. Martuza, … B. E. Bernstein Science (2014-06-12) https://doi.org/10.1126/science.1254257
24. A single-cell resolution map of mouse hematopoietic stem and progenitor cell differentiation
S. Nestorowa, F. K. Hamey, B. Pijuan Sala, E. Diamanti, M. Shepherd, E. Laurenti, N. K. Wilson, D. G. Kent, B. Gottgens Blood (2016-06-30) https://doi.org/10.1182/blood-2016-05-716480
25. Single-Cell RNA-Seq Reveals Lineage and X Chromosome Dynamics in Human Preimplantation Embryos
Sophie Petropoulos, Daniel Edsgärd, Björn Reinius, Qiaolin Deng, Sarita Pauliina Panula, Simone Codeluppi, Alvaro Plaza Reyes, Sten Linnarsson, Rickard Sandberg, Fredrik Lanner Cell (2016-09) https://doi.org/10.1016/j.cell.2016.08.009
26. A Single-Cell Transcriptome Atlas of the Human Pancreas
Mauro J. Muraro, Gitanjali Dharmadhikari, Dominic Grün, Nathalie Groen, Tim Dielen, Erik Jansen, Leon van Gurp, Marten A. Engelse, Francoise Carlotti, Eelco J.P. de Koning, Alexander van Oudenaarden Cell Systems (2016-10) https://doi.org/10.1016/j.cels.2016.09.002
27. Exploring nonlinear feature space dimension reduction and data representation in breast CADx with Laplacian eigenmaps and t-SNE
Andrew R. Jamieson, Maryellen L. Giger, Karen Drukker, Hui Li, Yading Yuan, Neha Bhooshan Medical Physics (2009-12-22) https://doi.org/10.1118/1.3267037
28. UMAP: Uniform Manifold Approximation and Projection for Dimension Reduction
Leland McInnes, John Healy arXiv (2018-02-09) https://arxiv.org/abs/1802.03426v1
29. Evaluation of UMAP as an alternative to t-SNE for single-cell data
Etienne Becht, Charles-Antoine Dutertre, Immanuel W.H. Kwok, Lai Guan Ng, Florent Ginhoux, Evan W Newell Cold Spring Harbor Laboratory (2018-04-10) https://doi.org/10.1101/298430
30. Principal component analysis
Hervé Abdi, Lynne J. Williams Wiley Interdisciplinary Reviews: Computational Statistics (2010-06-30) https://doi.org/10.1002/wics.101
31. Cross-Species Transcriptional Network Analysis Defines Shared Inflammatory Responses in Murine and Human Lupus Nephritis
C. C. Berthier, R. Bethunaickan, T. Gonzalez-Rivera, V. Nair, M. Ramanujam, W. Zhang, E. P. Bottinger, S. Segerer, M. Lindenmeyer, C. D. Cohen, … M. Kretzler The Journal of Immunology (2012-06-20) https://doi.org/10.4049/jimmunol.1103031